How to Find the ICT Daily Bias: The Two Published Rules
How to find the ICT daily bias: the two published rules, where they contradict each other by arithmetic, and how to test a bias rule on your history.
The ICT daily bias is the direction you expect the market to deliver in the session ahead, decided before that session opens. Only two published versions are mechanical enough to run: one reads today's close against yesterday's high and low, the other reads it against the midpoint of yesterday's range.
Written out side by side, the two rules agree on some days as a matter of arithmetic and contradict each other on a whole class of other days. One of them also has no answer at all on an inside day, and fires both directions at once on an outside day. All of that is visible in the rules themselves, before any measurement.
What is the ICT daily bias?
It is your expectation of direction for the coming session, set before it starts rather than read off what has already happened. TradeZella states it plainly: "The daily bias is your idea of which direction the market is more likely to move today or tomorrow, either up (bullish) or down (bearish)."
The cleanest separation of bias from trend comes from innercircletrader.net, an educator's site that sells an ebook on the same page: "Trend is what price has already done — visible higher highs and higher lows for an uptrend, lower lows and lower highs for a downtrend. Bias is what price is expected to do next, given the trend, the imbalances, and the next draw on liquidity." The same page gives the case that makes the distinction concrete: "A market can be in a clear uptrend with a temporary bearish bias for a single session if the next draw on liquidity sits below current price."
Not everyone accepts that the bias is about direction at all.
How do you find the ICT daily bias? The two rules, in full
Both published rules use nothing except the previous day's range, written out here so you can run them yourself.
Rule 1, from tradezella.com. The page says: "To determine the daily bias, ICT traders look at how the current day's candle closes in relation to the previous day's price range, specifically, the previous day's high and low." It gives four conditions, two per side.
- "Close Above Previous Day's High": today closes above yesterday's high.
- "Wick Below, Close Above": today trades below yesterday's low and closes back above that low.
- "Close Below Previous Day's Low": today closes below yesterday's low.
- "Wick Above, Close Below": today trades above yesterday's high and closes back below that high.
The first two read bullish, the last two bearish.
Rule 2, from innercircletrader.net. Its step-by-step workflow contains one testable line: a "close above midpoint of prior day's range suggests bullish carry; close below suggests bearish carry". The page never says how to work that midpoint out. Half of yesterday's high plus yesterday's low is the number, and it is the level a Fibonacci drawn across yesterday's range marks at 50%.
The other pages on the subject ask for a discretionary structure read instead: daily order flow, the draw on liquidity, the dealing range, the Asian-session range, the economic calendar. You cannot run a rule you cannot write down, and they do not claim to offer one.
Do the two rules agree?
Sometimes they must, and sometimes they cannot. Which case you are in depends on where today's close sits, and you can work it out without measuring anything.
Call yesterday's high H, yesterday's low L, and the midpoint M, which is halfway between them. Today's close is C.
- Rule 1 calls it bullish when C is above H. H is above M, so C is above M as well, and Rule 2 also calls it bullish. The two always agree here.
- Rule 1 calls it bearish when C is below L. L is below M, so Rule 2 also calls it bearish. They always agree here too.
- Rule 1 calls it bullish on the wick-below condition when today dips under L and closes back above L. That close can land anywhere above L, including between L and M. When it lands there, Rule 2 calls the same day bearish.
- Rule 1 calls it bearish on the wick-above condition when today pokes above H and closes back below H. That close can land anywhere below H, including between M and H. When it lands there, Rule 2 calls the same day bullish.
So the two rules can only contradict each other on the two conditions where today closes back inside yesterday's range, and they do contradict each other whenever that close finishes on the far side of the midpoint from the direction Rule 1 called. Every day that closes outside yesterday's range is a day the two rules agree by arithmetic.
If you want to know how often the two disagree on your own instrument, the days to count are the ones where price reached beyond yesterday's high or low and then closed back inside.
What happens on a day the rule fires both ways, or none?
Rule 1's four conditions are not mutually exclusive, and on one kind of day two of them fire in opposite directions.
That day is an outside day that closes back inside the prior range: price takes out yesterday's high and yesterday's low and closes between them, so "Wick Above, Close Below" and "Wick Below, Close Above" are both true on the same candle, one bullish and one bearish. The page does not mention that its conditions can collide, and one of the two innercircletrader.net pages is explicit that this should not happen: "The trick is a one-bias-per-day model. Once the daily MSS sets the bias, that is the only direction you trade."
The opposite problem is the inside day, where today's high does not reach yesterday's high and today's low does not reach yesterday's low. No close lands beyond either side and no wick reaches beyond either side, so none of the four conditions fires and Rule 1 returns nothing at all. TradeZella's page names the case in one sentence, near the end: "Sometimes, the daily bias may not play out cleanly. Price could stay inside the previous day's range or react to intraday liquidity that shifts the narrative." What it does not give is a rule for those days.
Rule 2 has the opposite property. A close is either above the midpoint or below it, so the midpoint rule answers every day except the one where the close lands exactly on the midpoint. It is never silent and it never contradicts itself, and it answers with less to go on.
Is the daily bias a forecast of today's close?
The sources disagree, and this one cannot be settled by looking at a chart, because it is a question about what the term means.
Both mechanical rules are built on the close. TradeZella's whole method reads "how the current day's candle closes in relation to the previous day's price range".
City Traders Imperium, a prop firm whose post is bylined April 2, 2025 and updated August 28, 2026, says that reading is the mistake. The daily bias "is not about predicting whether the daily candle will close bullish or bearish", and the page calls that "a common misunderstanding that leads many traders astray". Its own framing is that the bias pinpoints where price is likely to "raid liquidity inside today's candle", not how that candle will close.
If you are going to test a bias rule, a rule that predicts a close and a rule that predicts which side's liquidity gets taken need different columns in your results, and mixing them makes your record unreadable.
Bias against trend: what is the difference?
Trend describes what has already happened; bias is a statement about what has not happened yet. That is why a market can be trending up and carry a bearish bias for one session, which is the case innercircletrader.net describes above.
The practical consequence is that a bias has an expiry and a trend does not. Yesterday's bias is not evidence about today, and when you record results, each day's bias needs its own row.
Is the ICT daily bias accurate?
Nobody publishes a sample, so there is no answer to copy. Every accuracy claim on the subject arrives without an instrument, a date range or a number of days behind it, which means neither you nor anyone else can check it.
One of the two innercircletrader.net pages offers a faster single-timeframe shortcut and ranks it against the full method on exactly that kind of claim, saying the full framework has the better strike rate "because the trade only fires when every layer agrees". No market, no date range, no count of trades, nobody named as having measured it. The same site publishes both methods, so a reader is being asked to choose between two of its own products on a figure that does not exist on the page.
tradingfinder.com lists higher accuracy three times as a benefit, and its own text is circular about it: the daily bias is "accurate only when the trader correctly evaluates higher-timeframe structures, liquidity behavior, and price position". brokeragetoday.com devotes most of its space to tools and suggests you "Enhance accuracy with a ChatGPT trading indicator for entry and exit signals".
TradeZella's own page puts it plainly: daily bias is "a directional framework, not a guaranteed outcome". Treat any accuracy claim with no sample behind it as marketing, including when it is attached to a method you like.
How would you test a daily-bias rule on your own history?
Write the rule so it produces exactly one output per day, including "no answer", then step through history with the next day hidden and record what the rule said next to what actually happened.
The order matters, and so do three decisions you make before you count anything:
- Fix the session boundary in writing first. A daily candle depends on which hour your data provider calls the end of the day. A broker that closes the day at 17:00 New York will draw different daily candles from the same market, which means different highs, different lows and a different answer from the same rule. Neither is wrong; the two are just not comparable, and a rule built on yesterday's high and low is built on whichever boundary you chose.
- Give the rule a third output. "Bullish", "bearish" and "no answer" are three outcomes, not two. Rule 1 above produces nothing on an inside day, and dropping those days quietly removes a whole class of market from your sample.
- Count the rule's failures of definition before its results. How many days did it say nothing? How many did it say both? Those two numbers describe the rule itself and do not depend on what price did next, so they are the cheapest thing you can learn and the easiest to check.
Only then is it worth recording, per day, what the rule said and what the following session did, as two separate columns, with no score and no running total: at this stage you are checking whether the rule is even well defined, not whether it pays.
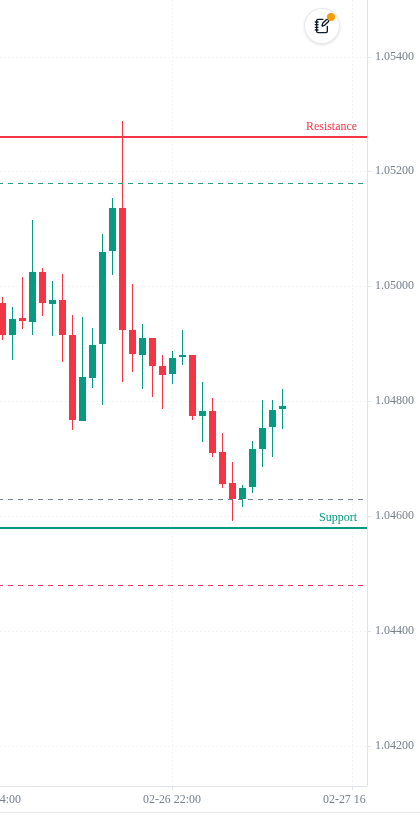
Stepping through a chart by hand is what keeps that honest. ChartLabs replays historical charts bar by bar, so the next candle is not on the screen while you are deciding what the rule says, and every trade you take stores the chart as you saw it. Our data is sourced from Dukascopy, cleaned to remove anomalies and built into 1-minute candles, which is what higher timeframes are aggregated from, so the daily boundary your test uses is one you can state. If you want the general method first, our beginner's guide to backtesting a trading strategy and our forex backtesting guide cover the setup, and backtesting accuracy, slippage and data quality covers what makes a historical test resemble live trading.
Both rules start from yesterday's high and low, and ChartLabs draws those for you. Previous Day Week Month High Low, under Levels & Sessions on the Standard tab of the Indicators menu, marks them as PDH and PDL, with last week's as PWH and PWL. Its Day Starts At setting is the boundary from step 1: Symbol session by default, which on forex runs 17:00 to 17:00 New York, with New York midnight and UTC midnight as the other options. Our daily candles split at 00:00 UTC, so on the default setting those lines can differ from the high and low of the 1D candle on your chart. It draws no midpoint, so for Rule 2 take the middle of the two lines yourself. Choose the boundary once, write it down, and keep it for the whole test.
Which page to read for what
If you want something you can run and test, the two rules above are what exists in print. For the discretionary framework in the most detail, City Traders Imperium's post sets out a five-step read: daily order flow, the dealing range, order blocks, the Asian range and the economic calendar. tradingfinder.com defines three identification routes structurally, without a mechanical test in any of them.
Where to go from here
Pick one of the two published rules, write it down with its three outputs, and run it over your own history with the next session hidden. You can do that on cleaned data, bar by bar, with every decision recorded as you made it, on a free trial of ChartLabs: 7 days free, one plan at $20 a month or $200 a year, and no card needed to start.
Related Topics
Related Guides
Forex Backtesting: Test Your Strategy on Real Data
A practical guide to backtesting forex strategies: why session dynamics, spread variation, and pair-specific behavior change your results, what clean historical data actually means, and a five-step process for testing a strategy before you risk real capital.
Backtesting a Trading Strategy: A Beginner's Guide
What backtesting is, why it matters, and how to run one step by step: defining your rules, choosing clean historical data, stepping through the chart trade by trade, logging results, and reading the metrics that tell you whether your strategy has a real edge.
Backtesting Accuracy: How Slippage and Data Quality Matter
Why backtest results and live results drift apart, and what actually closes the gap: clean tick data, honest spread assumptions, and commission and slippage modelled directly on every trade you log.