Backtesting Accuracy: How Slippage and Data Quality Matter
Why backtest results and live results drift apart, and what actually closes the gap: clean tick data, honest spread assumptions, and commission and slippage modelled directly on every trade you log.
Every trader who's backtested has had the same experience: the strategy looks great in testing, but the live results don't match. The backtest said 65% win rate and a 2.1 profit factor. Live trading says 55% and barely break-even.
What happened?
Usually, it's not the strategy. It's the gap between the idealized conditions of the backtest and the reality of live markets. Slippage, data quality, and spread modeling are the three biggest culprits, and understanding them is the difference between a useful backtest and a fantasy.
The Slippage Problem
Slippage is the difference between the price you expect and the price you actually get when your order executes. In backtesting, trades execute at exact prices. In live trading, they don't.
Why it happens. When you click "buy" in a live market, your order needs a counterparty. If the market is moving fast, the price can shift between your click and your fill. During news events, gaps can jump your entry or stop loss entirely.
How it affects backtesting. Most backtests assume perfect fills at the exact price your rules specify. Over hundreds of trades, even small slippage, 0.5 to 1 pip per trade, compounds into a significant drag on performance.
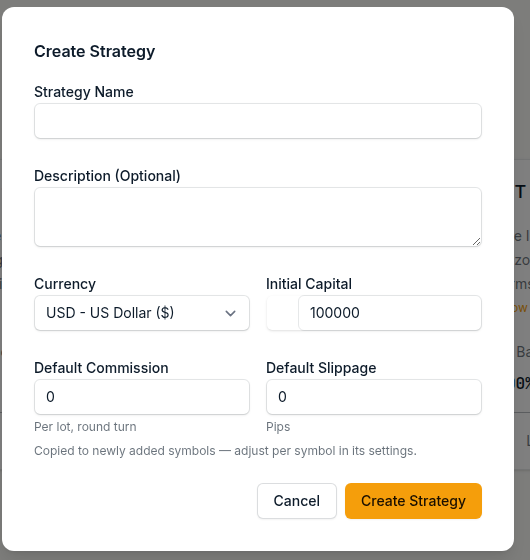
What to do about it. Model it instead of guessing at it. In ChartLabs you set commission and slippage per symbol, save them as a strategy default, and bulk apply them across symbols, so every trade you log carries its execution cost. Trades you already logged can be recalculated with one click. Strategies with very thin edges (profit factor under 1.3) are the ones whose edge disappears first once those costs are counted.
Manual backtesting helps here because you develop an intuitive sense for which entries are clean (price at your level with clear movement) and which are sloppy (chasing into momentum, entering during fast moves). Over time, you learn to identify the setups most likely to suffer slippage, before you're in them with real money.
The Data Quality Problem
This is the silent backtest killer. Bad data doesn't announce itself with error messages. It just quietly corrupts your results.
What Bad Data Looks Like
Price spikes. Sudden one-tick moves to extreme levels, then an immediate snap back. These are data artifacts from low liquidity periods or connectivity issues. They're not real prices that anyone could have traded at, but your backtest will happily trigger entries and exits on them.
Missing data. Gaps in the time series where no data exists. Some gaps are legitimate, since market closures and thin liquidity leave real holes in the record. What matters is how your backtesting platform handles them, because the wrong handling creates false signals or hides valid ones.
Bad ticks. Individual price points that are simply wrong: broker errors, data feed glitches, or interpolation artifacts. A single bad tick in the right place can turn a losing backtest into a winning one (or vice versa).
Why It Matters
A backtest on dirty data is testing a fiction. The phantom trades triggered by price spikes inflate your win rate and profit factor. When you go live and those spikes don't exist, your results deteriorate.
This is one of the most common and least understood reasons for the gap between backtest and live performance. Traders blame their psychology or their execution, when the real problem was the data they tested on.
What to Do About It
Use clean data. This sounds obvious, but most platforms don't clean their tick data. The anomalies are baked in.
ChartLabs addresses this systematically. We source data from Dukascopy, tick-level where it is available, and clean it to remove anomalies before building 1-minute candles.
Be skeptical of too-good results. If your backtest shows an unusually high win rate or profit factor, question the data before celebrating the strategy. Try the same strategy on data from a different source. If the results diverge significantly, data quality is likely the issue.
The Spread Problem
The spread, the difference between bid and ask price, is the cost of entering every trade. In backtesting, this cost is often underestimated or ignored entirely.
Fixed vs. variable spreads. Some backtesting platforms use a fixed spread for each instrument. But real spreads are variable. They widen during news events, low liquidity periods, and session transitions. A strategy tested with a 1-pip fixed spread on EUR/USD might face 3-5 pip spreads during the exact moments it triggers entries.
Impact on scalping strategies. Strategies that aim for small per-trade profits (5-15 pips) are most vulnerable to spread miscalculation. If your target is 10 pips and the real spread is 2 pips wider than your backtest assumed, you've just given up 20% of your expected profit on every trade.
Exotic pair spreads. Less liquid pairs have wider spreads, especially during off-peak hours. If you're backtesting strategies on exotic pairs, make sure your spread assumptions are realistic.
Making Your Backtests More Realistic
Use clean, reputable data. This is the single highest-impact improvement. Clean data removes the phantom trades and false signals that inflate backtest results.
Read your real cost numbers. Once commission and slippage are set, the Trading Costs card in analytics reports your total costs, your cost drag, and your average cost per trade. That turns execution friction from a rough estimate into a number you can act on.

Test across long time periods. Short backtests on favorable data are meaningless. Test across years of data that include trending markets, ranging markets, and volatile events.
Use manual backtesting. By stepping through data yourself, you develop judgment about which signals are tradeable in real conditions. An automated backtest fires on every signal regardless of context. You learn to distinguish between signals in clean, tradeable conditions and signals during chaotic, slippage-prone moments.
Compare results across data sources. If your strategy looks strong on one data set but mediocre on another, the data is the variable, not your strategy.
The Honest Answer
No backtest perfectly predicts live performance. There will always be a gap. But the gap can be small and manageable, or it can be an unpleasant surprise.
The difference comes down to how realistic your backtest is. Clean data, honest spread assumptions, costs modelled on every trade, and manual practice reduce the gap. Dirty data, perfect-fill assumptions, and automated backtesting on a single data source widen it.
Test honestly. Prepare thoroughly. Then trade with eyes open.
Clean historical data and manual backtesting at chartlabs.io. 7-day free trial, no credit card required.