// Manual backtesting for serious traders
Train beforeyou trade.
Manual backtesting that feels like live trading. Clean 1-minute data from Dukascopy. Professional analytics. One plan, everything you need.
- AUD/CAD
- AUD/CHF
- AUD/JPY
- AUD/NZD
- AUD/USD
- CAD/JPY
- CHF/JPY
- EUR/AUD
- EUR/CAD
- EUR/CHF
- EUR/GBP
- EUR/JPY
- EUR/NZD
- EUR/SEK
- EUR/TRY
- EUR/USD
- GBP/AUD
- GBP/CHF
- GBP/JPY
- GBP/NZD
- GBP/USD
- NZD/CAD
- NZD/CHF
- NZD/JPY
- NZD/USD
- USD/CAD
- USD/CHF
- USD/CNH
- USD/HKD
- USD/JPY
- USD/MXN
- USD/NOK
- USD/PLN
- USD/SEK
- USD/TRY
- USD/ZAR
- ASX 200
- China A50
- US Dollar Index
- Euro Stoxx 50
- CAC 40
- DAX 40
- Hang Seng
- FTSE MIB
- Nikkei 225
- Nasdaq 100
- AEX 25
- WIG20
- S&P 500
- IBEX 35
- SMI 20
- FTSE 100
- Russell 2000
- Dow Jones
- VIX
- Cardano
- Basic Attention Token
- Bitcoin Cash
- Bitcoin
- Dash
- Ethereum
- Chainlink
- Litecoin
- TRON
- Uniswap
- Stellar Lumens
- Copper
- Silver
- Gold
- Palladium
- Platinum
- Brent Crude
- Natural Gas
- WTI Crude
// How we see it
Backtesting is training. No one becomes a professional athlete from the couch. No one becomes a profitable trader without putting in the hours. This is where you put them in.
// How it works
Train on real history.
No code, no setup.
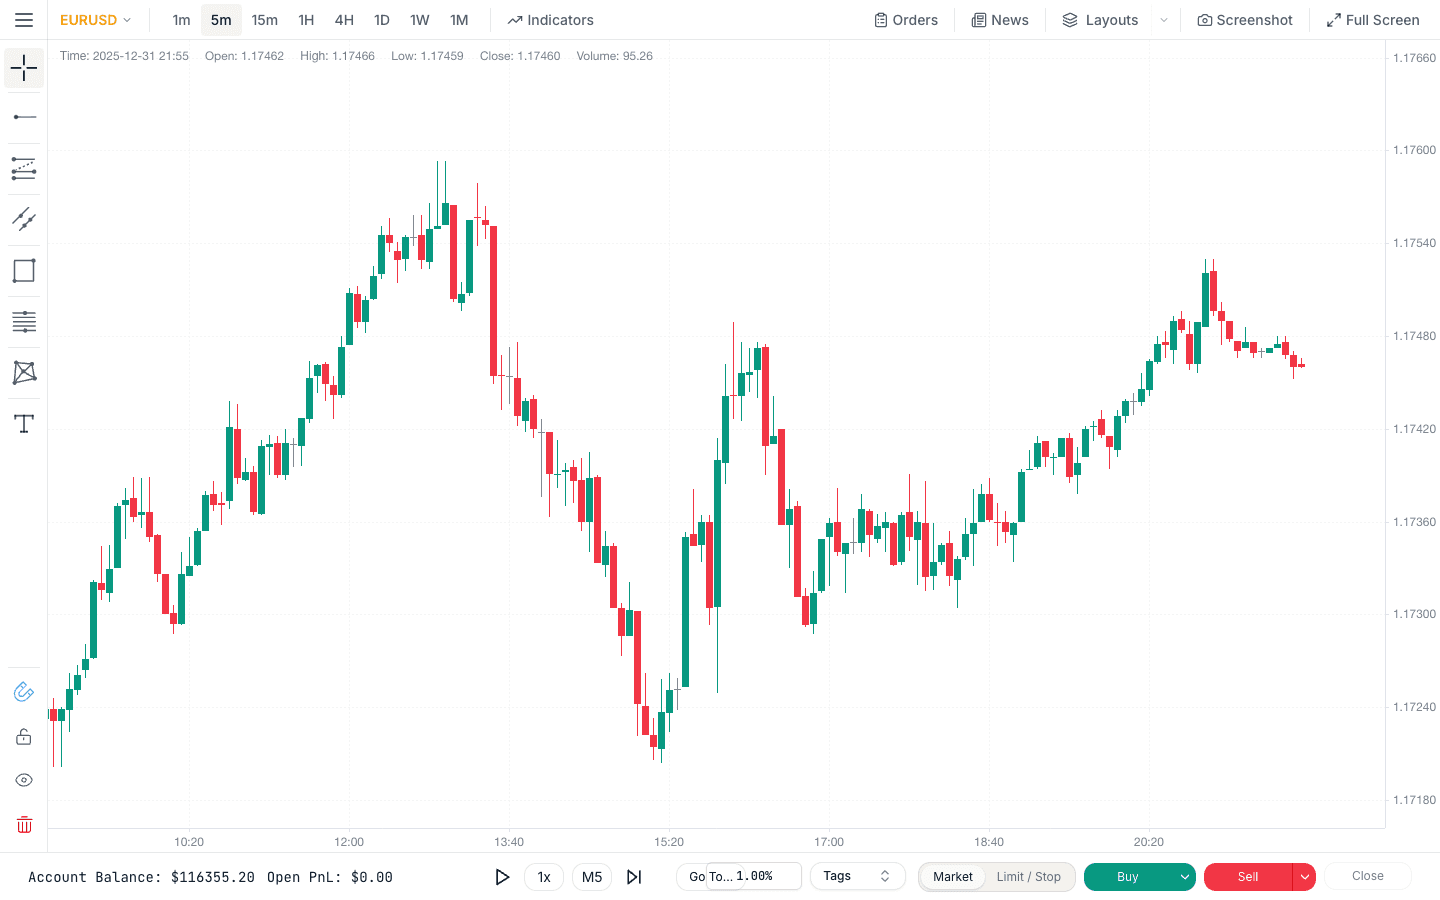
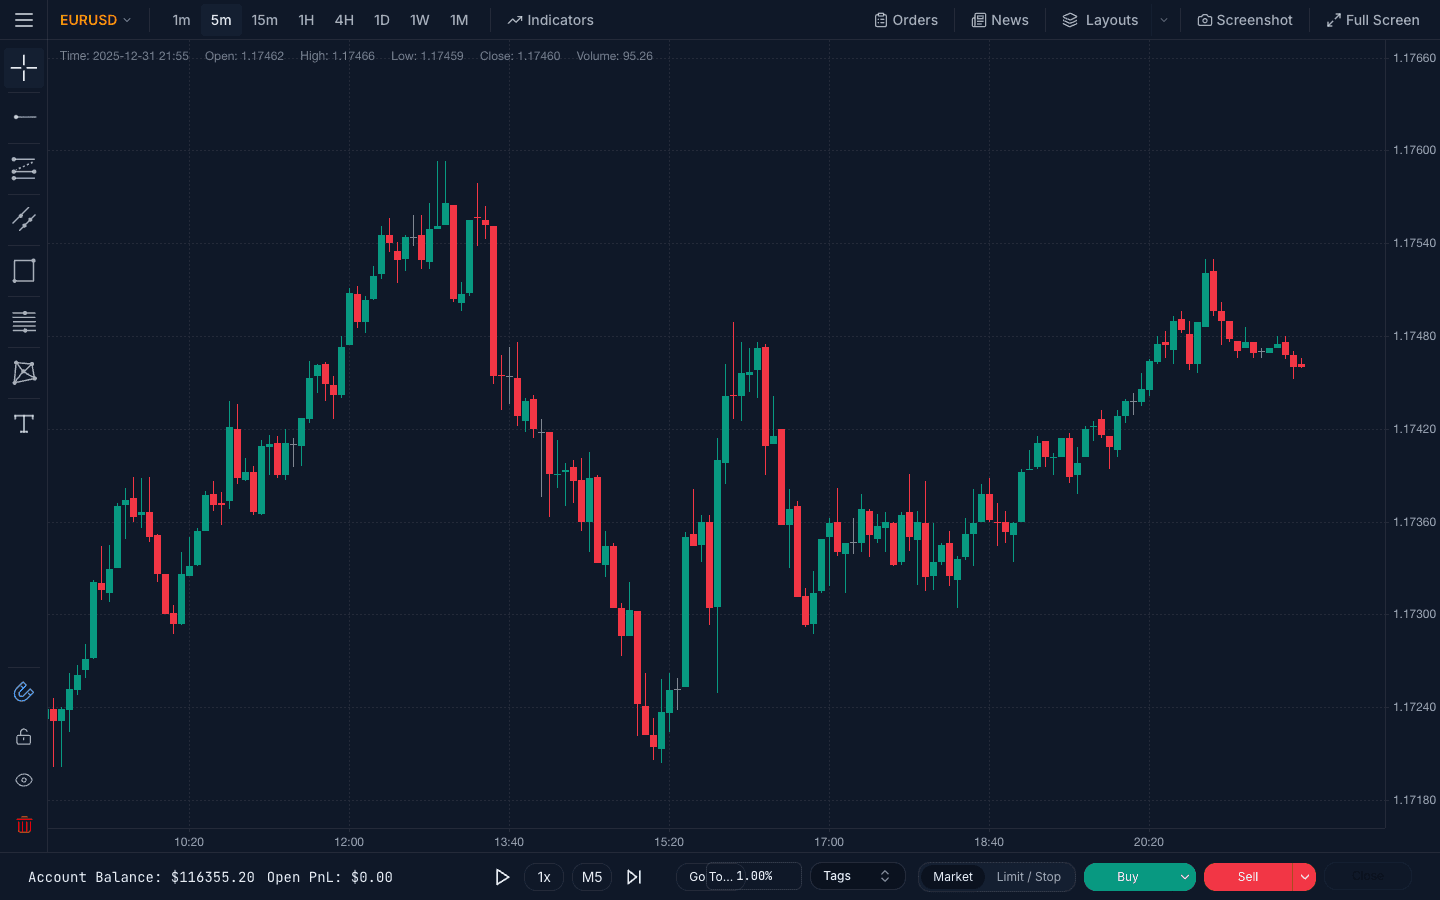
If you can trade live, you already know how to use ChartLabs. The whole point is that it feels the same.
Pick a market and a date
Choose an instrument and drop into any point in years of cleaned history.
Trade the chart, bar by bar
Step forward at your own pace. Place orders, set your stop and target, manage the position like you would live.
Review the analytics
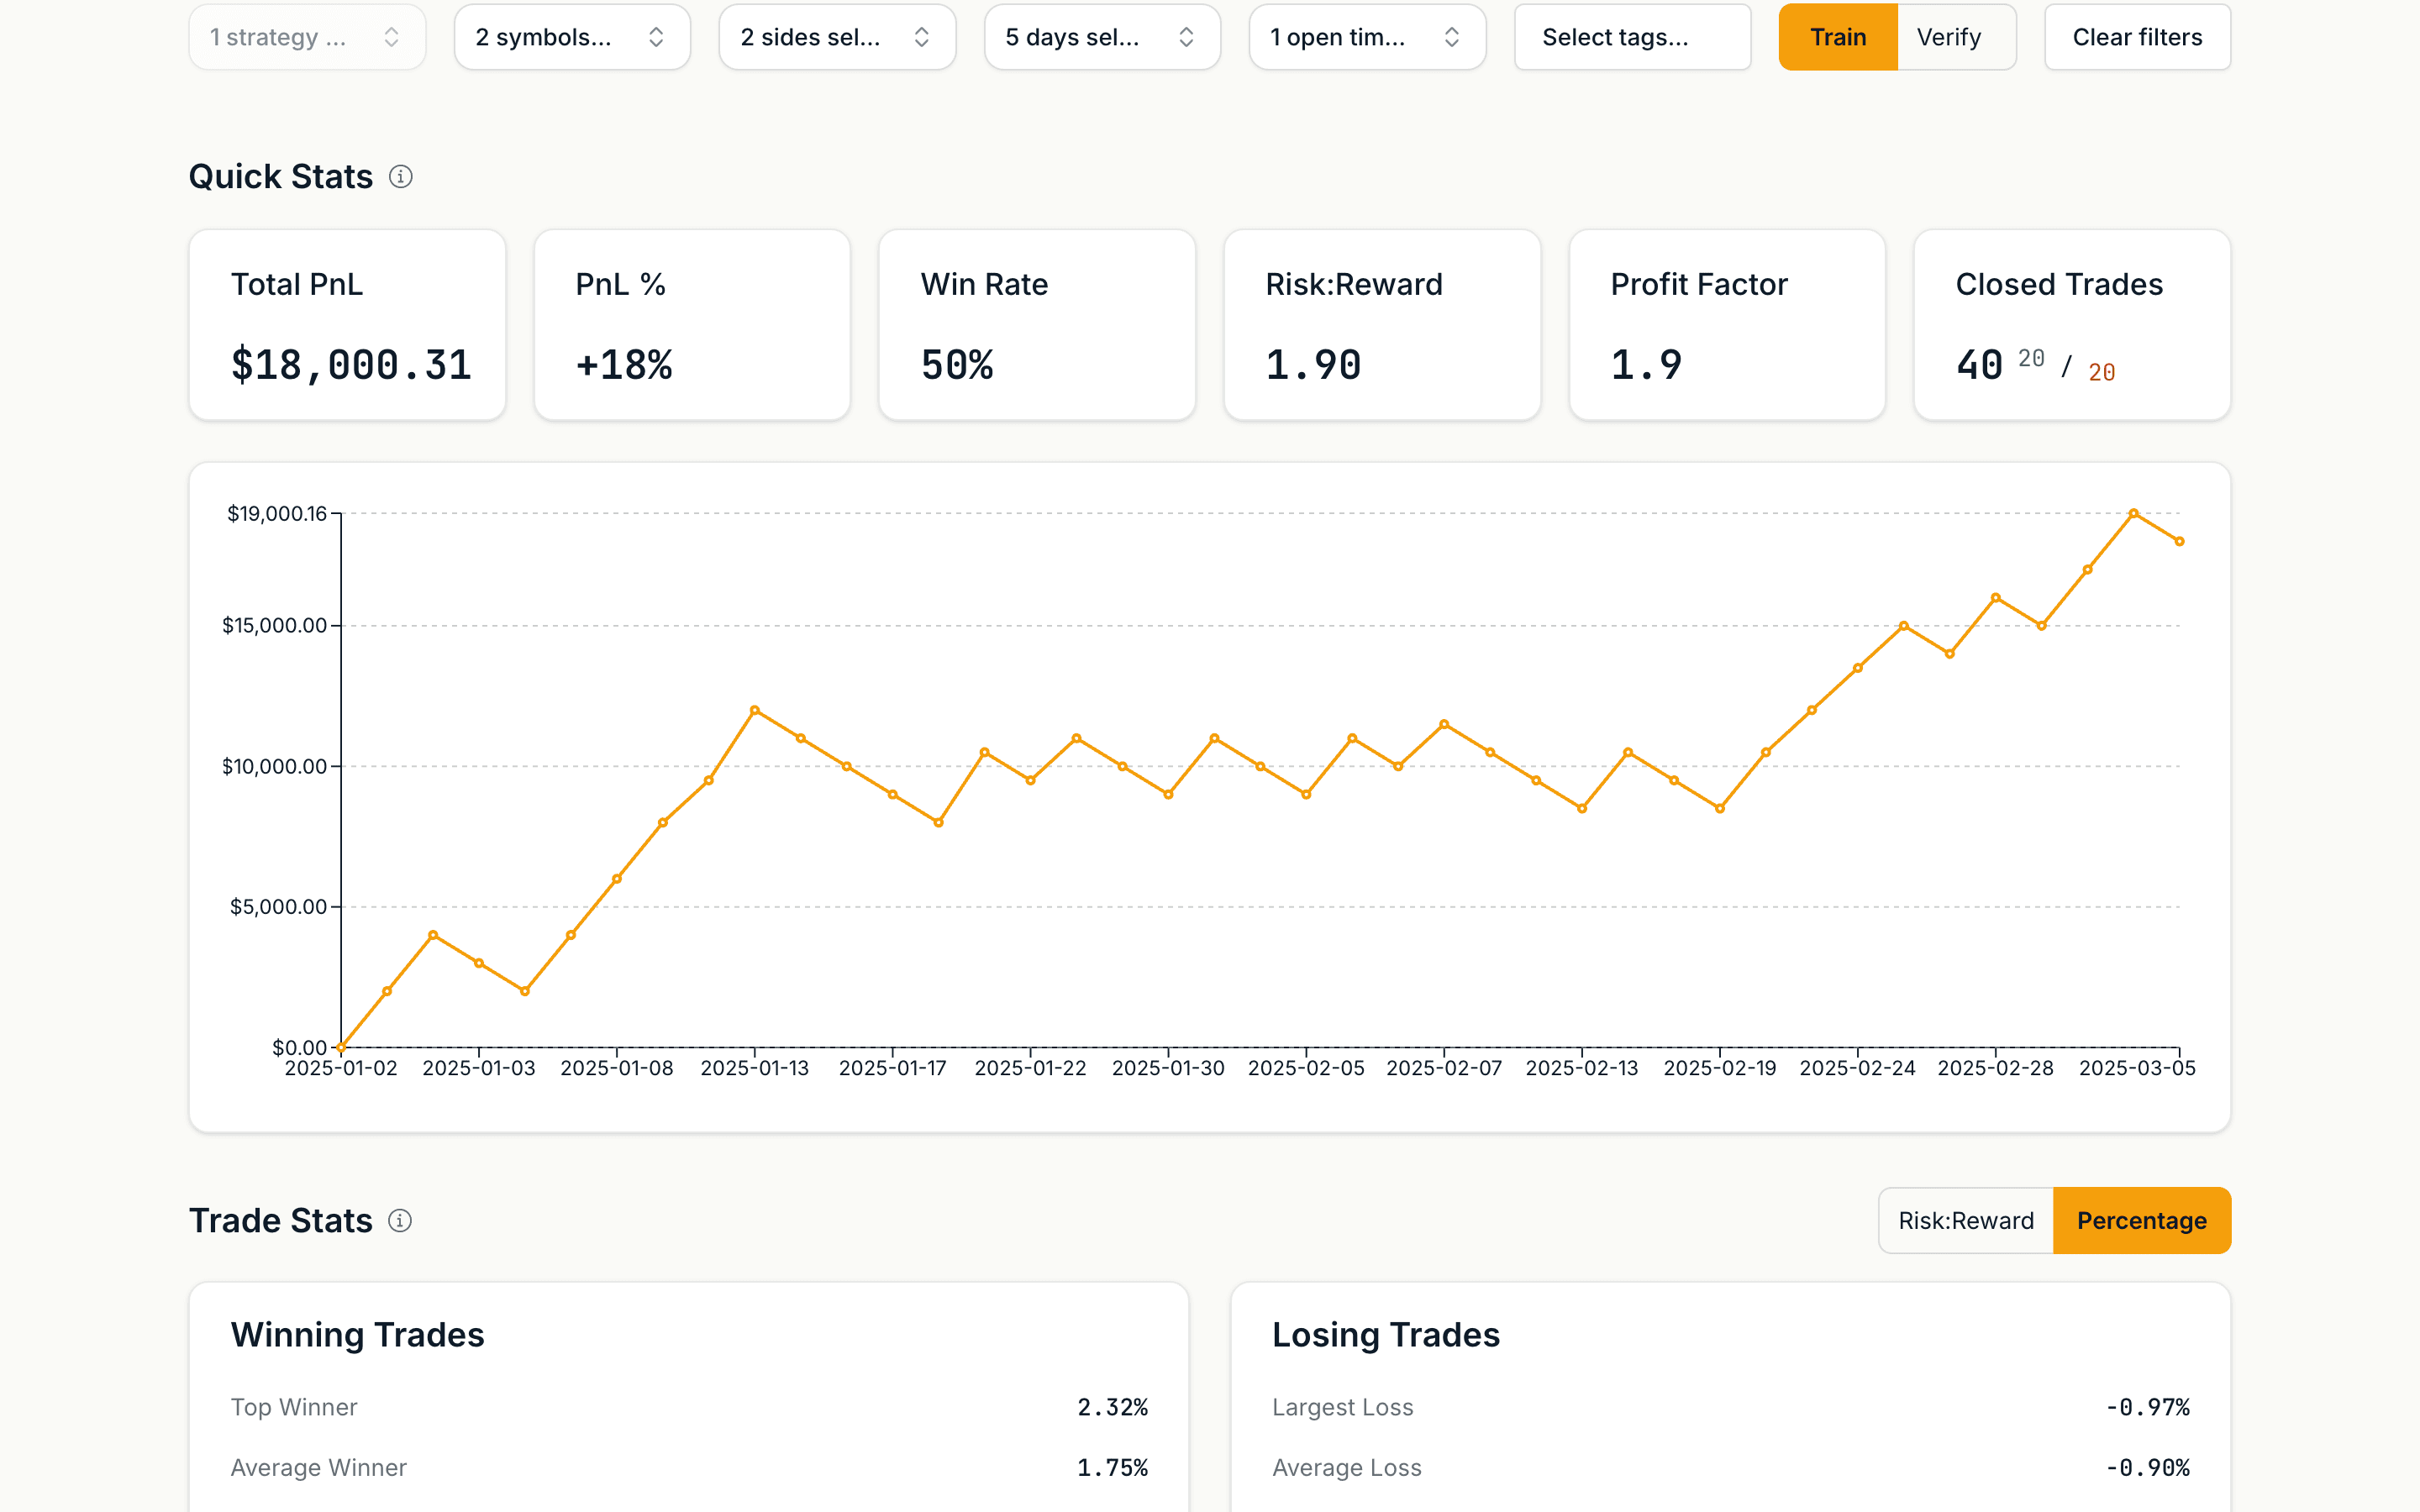
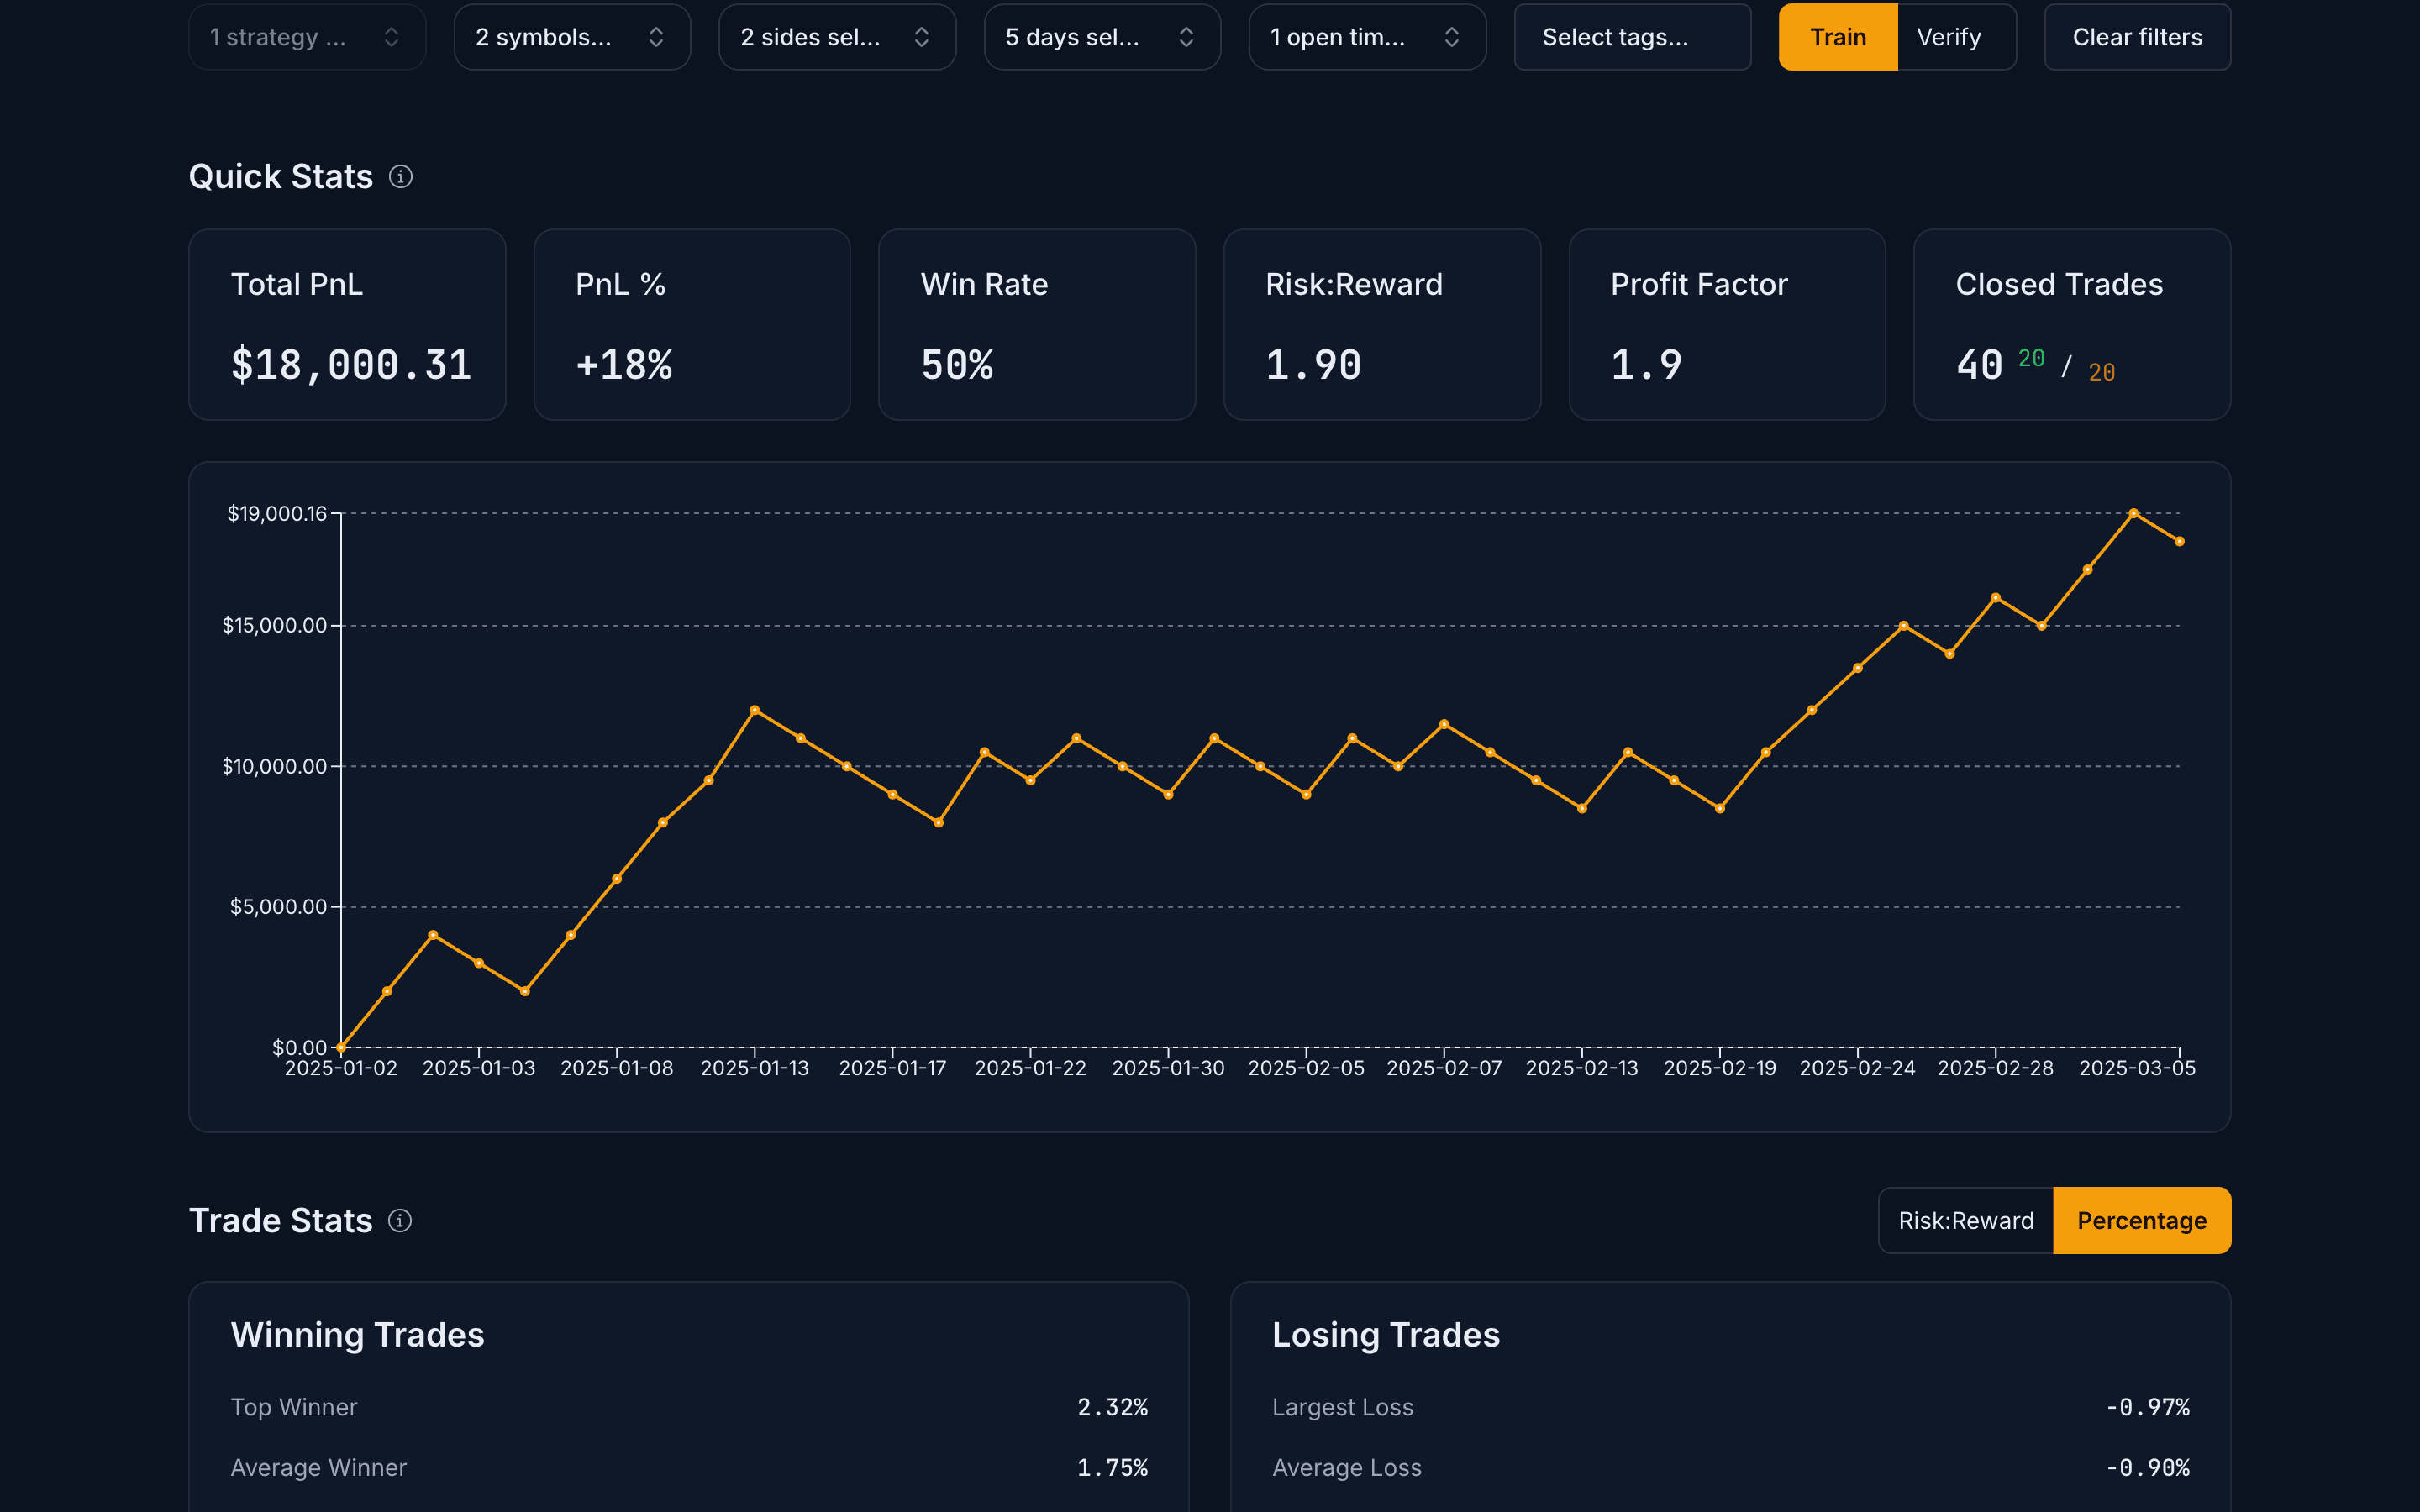
Every session feeds your stats: profit factor, drawdown, risk-adjusted returns and timing breakdowns.
Verify on unseen data
Prove the edge on a locked date range, each symbol used once. Built for out-of-sample testing on data you set aside.
// Six things we got right
Every feature has to earn its place.
We use ChartLabs ourselves, with real money on the line. If a feature does not add value, it does not ship.
CLEAN DATA
1-minute data, scrubbed in-house.
Sourced from Dukascopy and cleaned to remove anomalies before you ever see a candle. Your backtest reflects the market, not data artifacts.
EXECUTION
Manual orders, real decisions.
Market, limit and stop orders with stop loss and take profit. Multiple position sizing methods. The same flow as your live broker.
ANALYTICS
Metrics that matter.
Win rate, profit factor, drawdown, Sharpe, Sortino, Calmar. Monte Carlo simulation and strategy correlation. The numbers that show whether your edge is real.
MULTI-MONITOR
Multi-monitor charts.
Pop charts into separate windows across your physical monitors and set up the way you trade live. More timeframes and markets in view at once, without squeezing them into one browser tab.
JOURNAL + TAGS
Snapshot and tag every trade.
Every trade automatically saves a picture of your chart with your drawings and notes. Tag trades as you go, then filter every stat by tag to see which setups actually work.
NO GAMES
Zero gamification.
No leaderboards, badges, streaks or points. The psychology that keeps people glued to their phones is the one that blows up accounts. This is a tool, not a toy.
// Our real edge
Most platforms feed you dirty data.
Raw data straight from the source includes price spikes and anomalies that would not happen in real trading. Test on it and your backtest is testing a fiction. We clean ours before you see a candle, so you can trust what you see.
- 01Source tick-level data from Dukascopy, where it is available
- 02Clean it to remove anomalies
- 03Convert it to 1-minute candles, the lowest timeframe
- 04Where the source has no data, show none. We never fill it in.
// Analytics
The metrics fund managers actually use.
Profit factor, Sharpe, Sortino, Calmar, Monte Carlo simulation, strategy correlation, timing by hour and weekday. The full picture of your strategy, not vanity stats.
// Train, then verify
Prove it on data you have not seen.
Train on one period, then verify on another. Verification locks the date range and verifies each symbol only once, so a green chart reflects out-of-sample performance, not overfitting.
// Prop firms
Pass the challenge, not your savings.
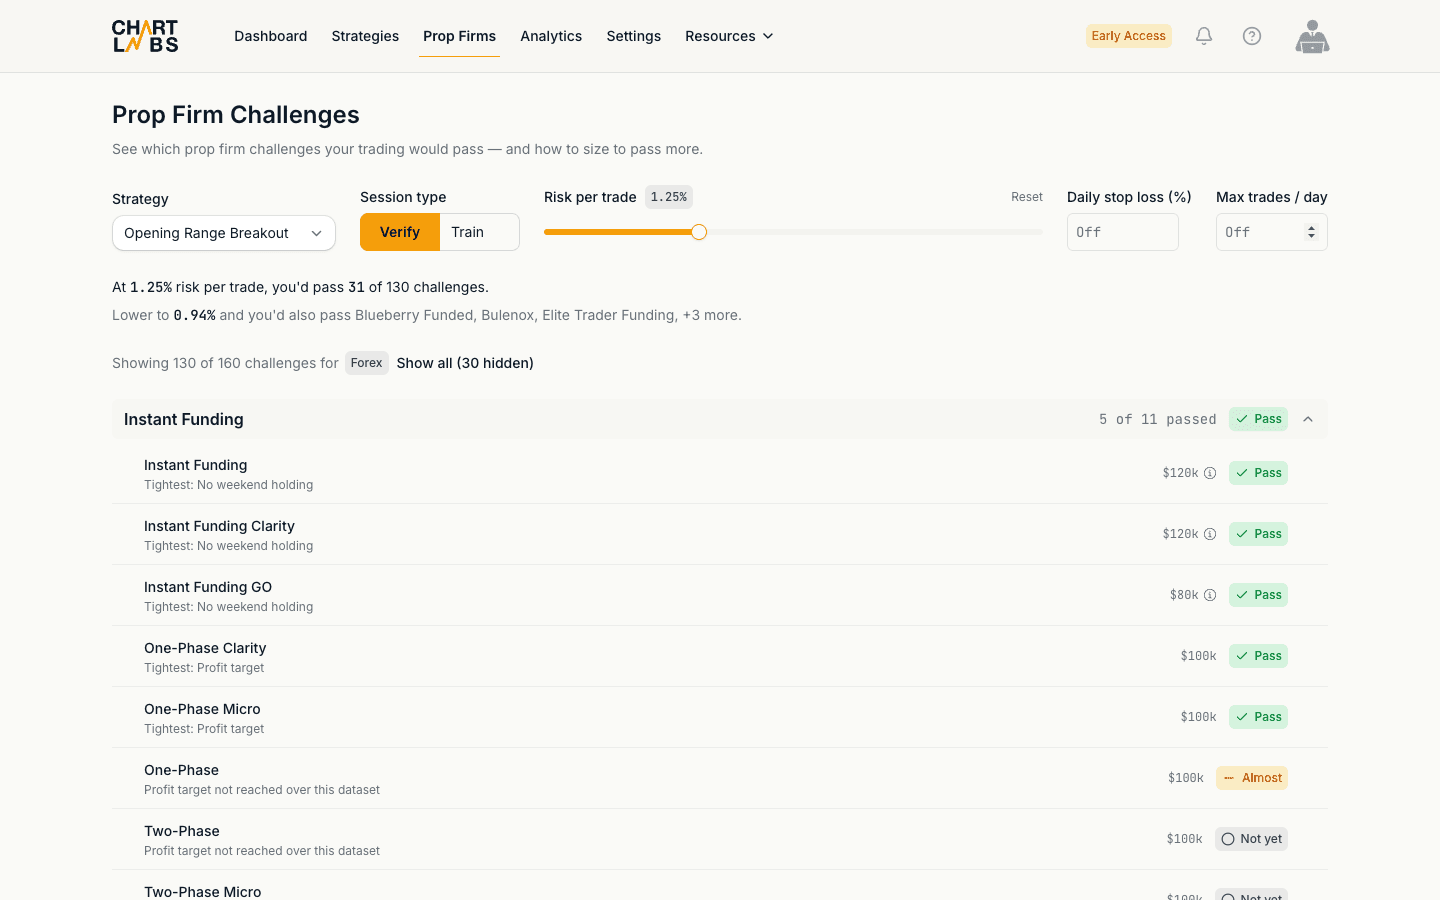
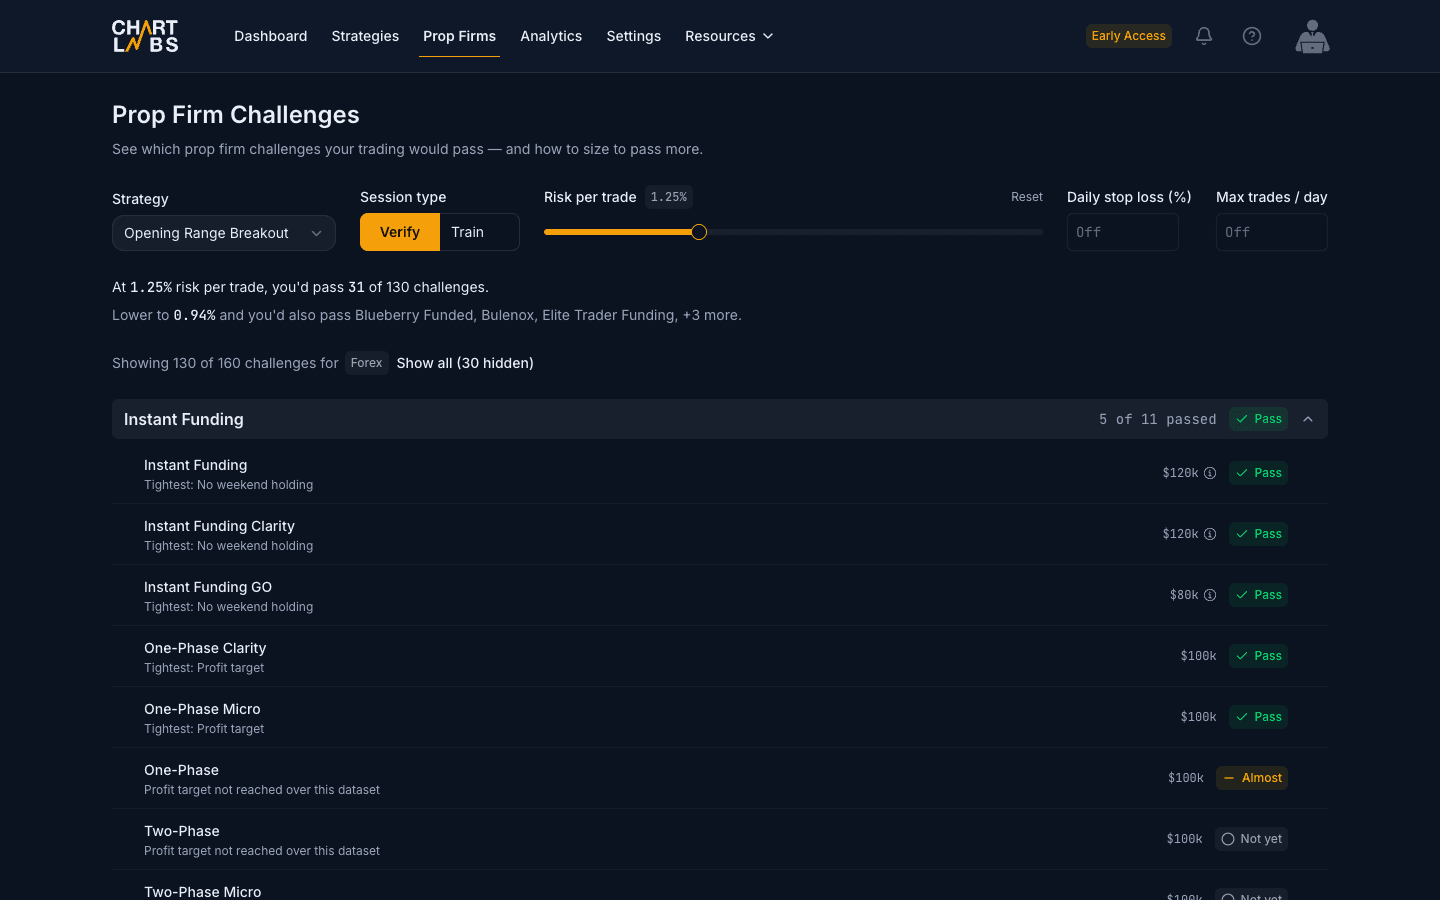
Most traders fail a prop firm evaluation because they walk in undertrained. ChartLabs scores your backtested trades against real firm challenges (profit target, drawdown, daily loss, consistency, trading days) and shows which ones your trading would pass. Then it shows how to size your risk to pass more.
- Scored on your verification trades: the out-of-sample record from the last step.
- Checks drawdown and daily loss intraday, the way a firm actually would, not just on closed trades.
- Shows how to size your risk to pass more of the challenges you are close on.
A month of unlimited practice costs less than a single failed evaluation fee. Earn the Pass here first.
// Why we built it
Built by a trader who got fed up.
One plan. $20 a month. No games.
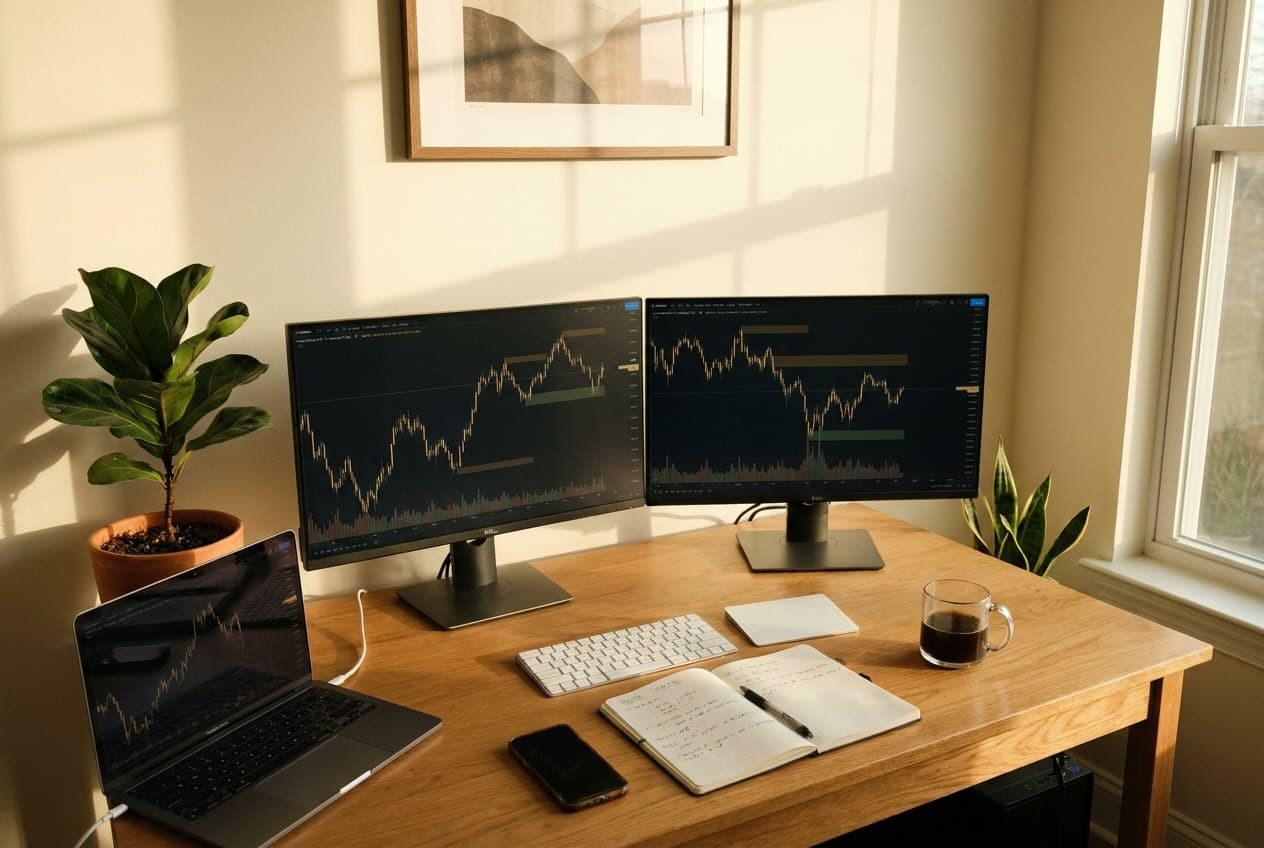
ChartLabs started because our founder, a full-time forex trader, couldn't find a backtesting tool that just worked. Clean data, simple interface, fair price. Every tool he tried was missing at least one.
Most platforms are bloated with features nobody asked for, or they gamify everything so you stay logged in instead of actually getting better. And the ones that do work? They lock the good stuff behind a "Pro" tier that costs more than some people's trading accounts.
We trade with real money too. If the data is bad or the tools are slow, we feel it. So we built what we actually need and left out the rest.
NO CREDIT CARD REQUIRED
// Pricing
One plan. Everything a trader needs.
Every trader deserves professional tools, not just the ones who can afford the top tier. One plan, a free trial, no credit card. Every feature we build is in it. Nothing held back behind a higher tier.
NO CREDIT CARD REQUIRED
- Unlimited strategies
- Unlimited backtests
- Unlimited chart windows
- Unlimited data retention
- Complete analytics suite
- All available symbols
- Economic events
- Custom indicators
// FAQ
Questions, straight answers.
01What makes ChartLabs different?
Three things. We are built for manual backtesting, so you practice candle by candle and build real pattern recognition. Our historical data is cleaned before it reaches you. And there is one plan at $20 a month with everything you need to trade. No tiers, no games.
02Is the data actually clean?
Yes. We source data from Dukascopy, tick-level where it is available, clean it to remove anomalies, and convert it to 1-minute candles. Most platforms skip the cleaning. We do not.
03What can I backtest?
Forex, indices, crypto and commodities, on any timeframe from 1 minute up to monthly. Years of clean history across trending, ranging and volatile market conditions.
04Can I use it to prepare for a prop firm challenge?
Yes. Many of our traders do exactly that. Backtest on the pairs and timeframes your firm uses, then score your trades against real prop firm challenges to see which ones you would have passed, and how to size your risk to pass more, before you pay another evaluation fee.
05Do I need to code?
No. You trade the chart yourself. No scripts, no setup. If you can read a chart and place an order, you can use ChartLabs.
06Can I try it first?
Yes. The free trial gives you full access to everything, with no credit card required. After that it is $20 a month, or $200 a year with two months free. Cancel anytime.
Put in the hours.
Before they cost you.
Try everything free. No credit card. Then $20 a month if you want to keep going.