Backtesting Across Multiple Monitors: Charts, Drawings, and Shortcuts
ChartLabs opens charts as independent windows, so a backtesting setup can spread across every monitor on your desk instead of being squeezed into one. Here is how the charts, layouts, drawing tools, and shortcuts fit together.
Charts on separate monitors
Most backtesting and charting platforms keep every chart inside a single browser window or application frame. If you have three screens, you still end up resizing panels on one of them while the other two sit empty.
ChartLabs charts open as separate windows. Drag them onto different physical monitors and arrange them the way you arrange your live screens.
Why it matters for backtesting
If you trade on multiple monitors, your live setup probably has a main chart on one screen, a higher timeframe on another, and something else on a third. When backtesting crams all of that into one window, you are practising a workflow you do not actually use.
That undermines the point of manual backtesting. You are building familiarity with the way you trade, and that includes where your eyes go and what sits in your peripheral vision. Matching your screen positions keeps practice conditions close to performance conditions.
Chart layouts
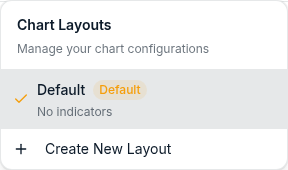
You can save a chart layout and load it again later, so the arrangement you built across monitors is waiting next time, along with your indicator setup.
Templates exist as well, but they work at a smaller scale than a whole layout: drawings and indicators each have their own presets you can save and reuse, so a trend line you styled once comes back styled that way.
Drawing shortcuts
Five drawing tools have keyboard shortcuts:
| Shortcut | Tool |
|---|---|
Alt+T | Trend line |
Alt+H | Horizontal line |
Alt+J | Horizontal ray |
Alt+V | Vertical line |
Alt+F | Fibonacci retracement |
On a Mac, use Option rather than Alt. Not Cmd.
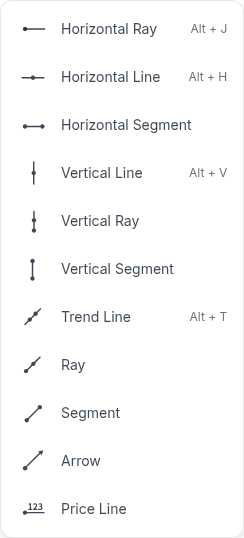
These are the tools you reach for most while stepping candle by candle, which is why they are the ones bound to keys. Marking a level should not cost you a trip to a toolbar.
Working with a drawing
Esccancels a drawing you are in the middle of placing.DeleteorBackspaceremoves the drawing you have selected.Endjumps the chart to the latest candle.
There is no undo or redo shortcut for drawings. If you place one you did not want, select it and delete it.
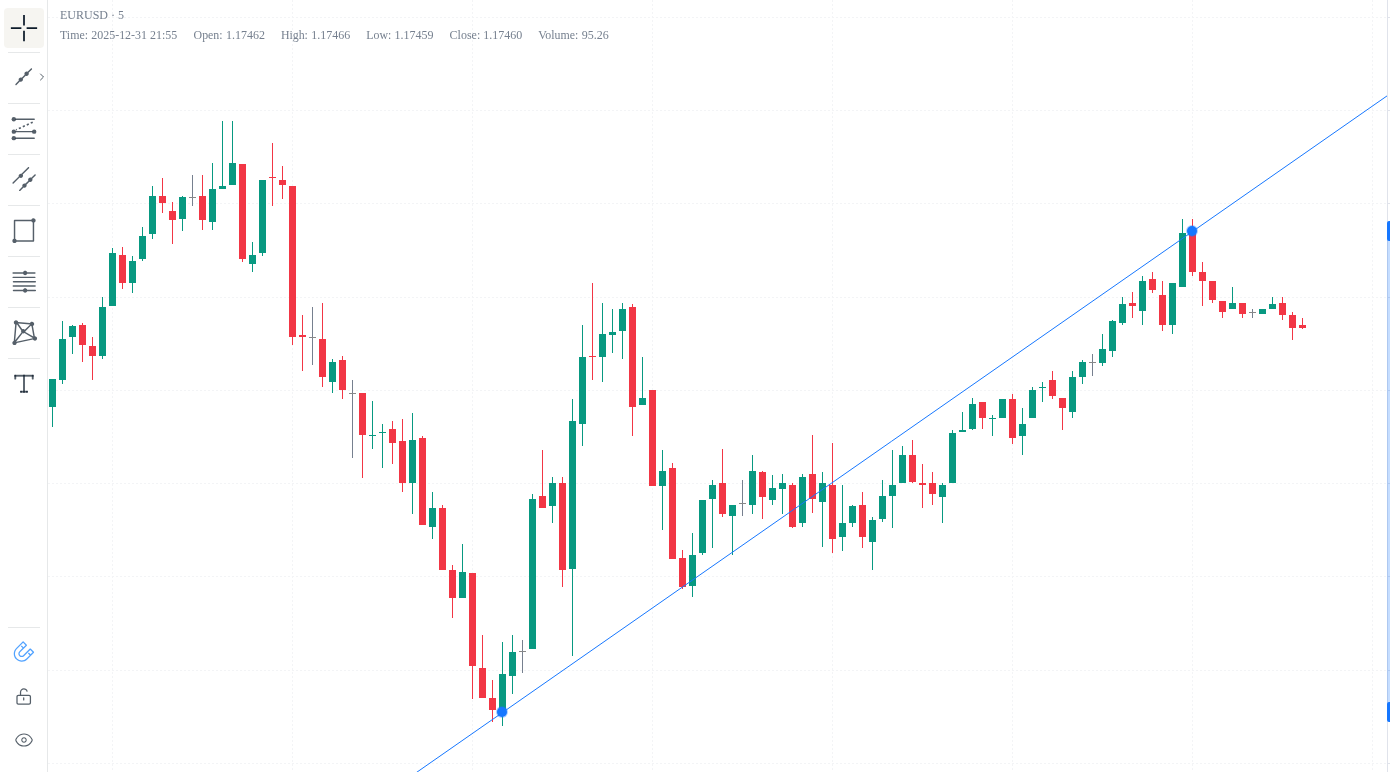
Every drawing uses the same settings dialog. Right-click the drawing itself, not the empty chart beside it, and choose Settings. Color, line style, and the rest live in one place, so you are not learning a different panel for each tool. The same menu carries Templates and Delete.
Notes on the chart
You can add text notes directly to a chart. They are useful for marking why a level matters, or leaving yourself the reasoning behind a decision you want to revisit when you review the session later.
Availability
Multi-monitor charts, saved layouts, drawing tools, and shortcuts are part of ChartLabs for every user, including during the 7-day free trial. One plan, $20/month or $200/year. No credit card required to start.