Forex Backtesting: Test Your Strategy on Real Data
A practical guide to backtesting forex strategies: why session dynamics, spread variation, and pair-specific behavior change your results, what clean historical data actually means, and a five-step process for testing a strategy before you risk real capital.
The forex market is enormous, and it never sleeps. With 24-hour sessions, dozens of currency pairs, and constant macro events, having a tested strategy isn't optional. It's the only way to trade with confidence.
Backtesting lets you test your forex strategy against years of historical price data to see how it would have performed before you risk real capital.
Why Forex-Specific Backtesting Matters
Forex has characteristics that make backtesting both more important and more nuanced than other markets:
Session dynamics. The forex market runs 24 hours, but activity and volatility vary dramatically across the Asian, European, and US sessions. A strategy that works during London open might fail during the Asian session. Backtesting across full historical periods exposes these session-specific patterns.
Spread variation. Forex spreads widen during low liquidity periods (overnight, holidays, major news events). A scalping strategy might look profitable on fixed-spread data but fall apart when realistic spread variation is applied.
Macro sensitivity. Currency pairs react to central bank decisions, employment data, geopolitical events. Your strategy needs to perform across these environments. Backtesting on 10+ years of data covers multiple economic cycles.
Pair-specific behavior. EUR/USD behaves differently from GBP/JPY. Each pair has its own volatility profile, spread characteristics, and correlation patterns. A strategy that works on one pair isn't guaranteed to work on another.
What You Need for Reliable Forex Backtesting
Clean Historical Data
This is the foundation. Forex data quality varies enormously between sources. Raw tick data from many brokers contains price spikes from low-liquidity periods, bad ticks, and gaps that create phantom signals in your backtest.
We source data from Dukascopy, tick-level where it is available, and clean it to remove anomalies before building 1-minute candles. The 1-minute candle is the lowest timeframe that matters for building sustainable strategies.
How far back the data goes depends on the symbol: up to around 22 years on the oldest forex pairs, with other instruments starting later.
Realistic Execution Modeling
A backtest is only useful if it approximates real trading conditions. For forex, this means accounting for spread (the cost of entering a trade), commission, and slippage on entries and exits.
ChartLabs sets commission and slippage per symbol, with defaults on the strategy and bulk apply across symbols. Change the numbers and one click recalculates the trades you have already logged, and the Trading Costs card in analytics shows what those costs took out of your results.
Enough Data for Statistical Significance
Test across at least several years of data and generate at least 100-200 trades. Anything less and your results could be statistical noise rather than a real edge.
Forex Backtesting Step by Step
1. Define Your Strategy
Write down your rules clearly: entry criteria, exit criteria, stop loss placement, take profit targets, and any filters (time of day, session, day of week).
For forex strategies, also define: which pairs you trade, which sessions you're active during, and how you handle news events.
2. Select Your Pairs and Timeframe
Start with the major pairs. They have the most historical data and the tightest spreads. If your strategy works on majors, you can test it on crosses and exotics later.
Choose a timeframe that matches your trading style. Swing traders might use 4-hour or daily charts. Day traders might use 15-minute or 1-hour charts. Scalpers might go down to the 1-minute chart, but be honest about whether sub-5-minute strategies are sustainable long-term.
3. Walk Through the Data
With manual backtesting, step through the historical data candle by candle. When your strategy signals an entry, place the trade. Set your stop loss and target. Watch it play out.
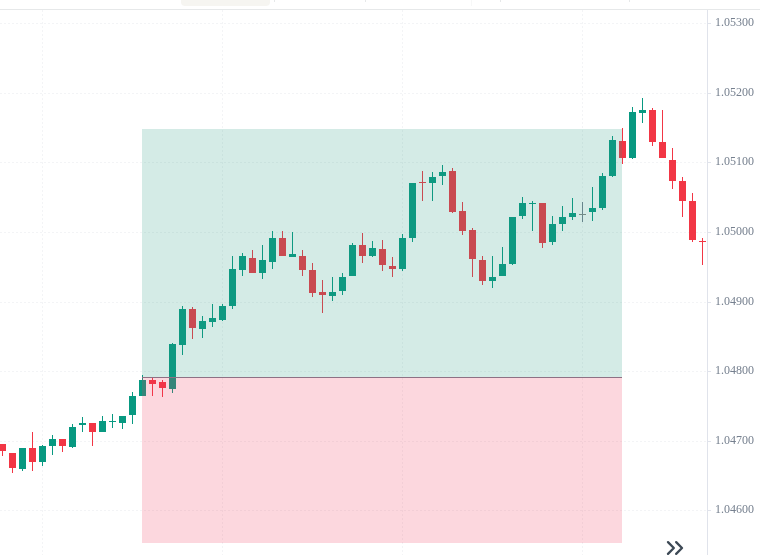
Don't cherry-pick. Don't skip setups that "don't look right." Trade every valid signal your rules generate. That's how you get honest results.
4. Analyze Session Performance
One of the most valuable insights from forex backtesting is session-specific performance. Use timing analysis to see how your strategy performs during different market hours:
Do you trade better during London session? Is your strategy profitable during Asian hours, or do the wider spreads eat your edge? Do US session trades have a different win rate?
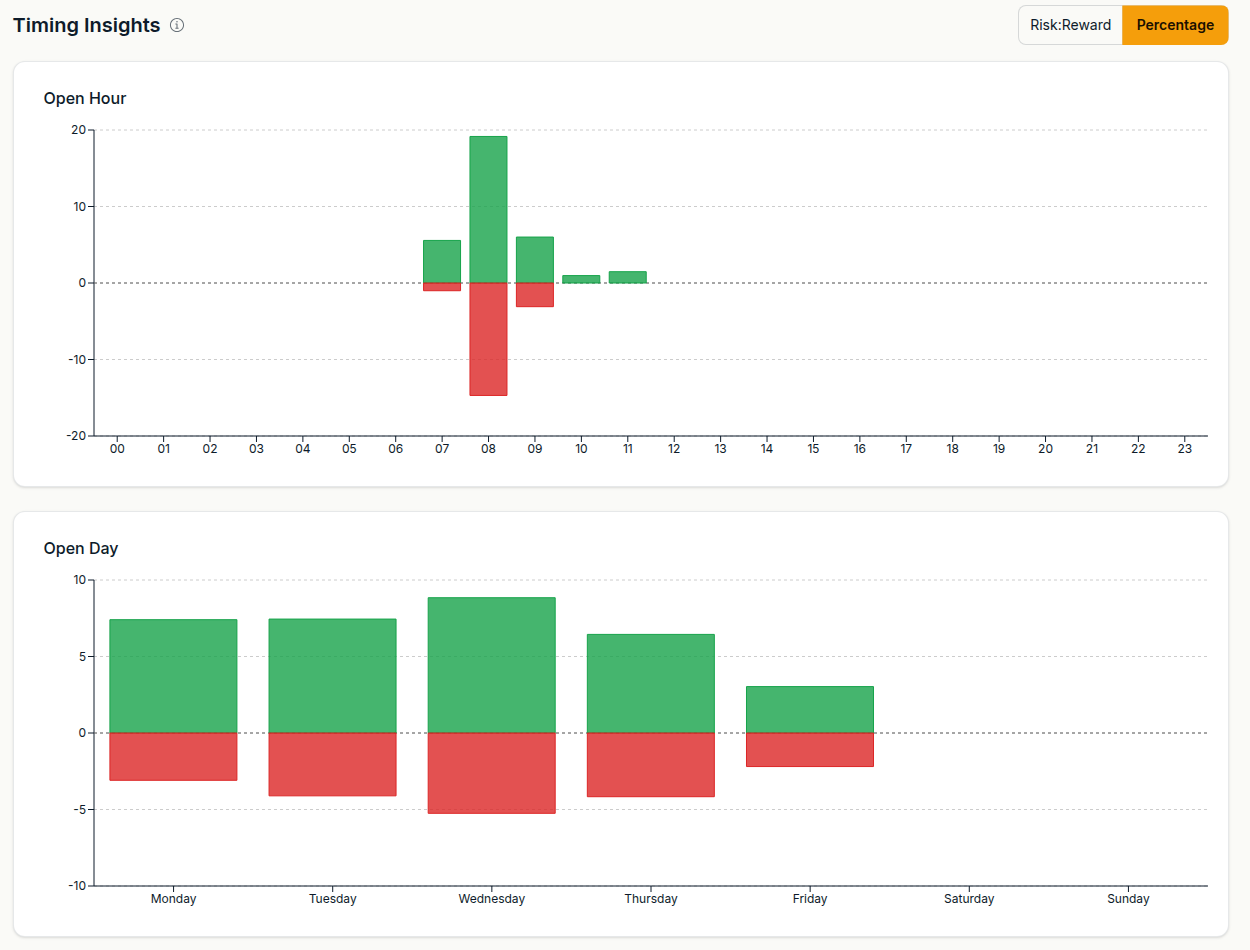
This analysis can dramatically improve your strategy by helping you focus on the sessions where you have an actual edge.
5. Review Risk Metrics
For forex specifically, pay attention to:
Maximum drawdown. Can you survive the worst losing streak your backtest reveals?
Profit factor by pair. Some pairs might be profitable while others drag down your overall results. Consider dropping the underperformers.
Risk-adjusted returns. Sharpe and Sortino ratios tell you whether your returns justify the risk you're taking.
Common Forex Backtesting Mistakes
Testing only on trending markets. Forex ranges more than it trends. If your backtest period is all trending, your results are misleading.
Ignoring the spread. Especially on lower timeframes, the spread is a significant cost. A strategy that shows 10 pips profit per trade with zero spread might break even with realistic spreads applied.
Testing on one pair and assuming it works on all. Every pair has unique characteristics. Test each pair individually.
Using free broker data without cleaning. It's tempting, but the anomalies in uncleaned data produce results that don't hold up in live trading.
Getting Started with Forex Backtesting
ChartLabs gives you clean forex data going back up to around 22 years on the oldest pairs. The platform is built specifically for manual backtesting: step through data candle by candle, place trades, and review comprehensive analytics including session timing insights.
One plan: $20/month or $200/year. 7-day free trial, no credit card required, at chartlabs.io.