Backtesting a Trading Strategy: A Beginner's Guide
What backtesting is, why it matters, and how to run one step by step: defining your rules, choosing clean historical data, stepping through the chart trade by trade, logging results, and reading the metrics that tell you whether your strategy has a real edge.
If you have a trading strategy but you're not sure whether it actually works, backtesting is how you find out, without risking real money.
This guide covers what backtesting is, why it matters, and how to do it step by step.
What Is Backtesting?
Backtesting means testing a trading strategy against historical market data. Instead of trading live and hoping your strategy works, you test it on data from the past, where the outcome is already known, to see how it would have performed.
Think of it as a dress rehearsal. Athletes practice before competitions. Pilots train in simulators before flying. Backtesting is a trader's version of practice.
There are two main approaches:
Automated backtesting runs your strategy rules through historical data programmatically. It's fast, but it removes you from the decision-making process.
Manual backtesting lets you step through historical data yourself, candle by candle, making trading decisions in real time. It's slower, but it builds something automated backtesting can't: experience, pattern recognition, and the confidence to execute your strategy under pressure.
Why Backtesting Matters
Most traders who lose money aren't using bad strategies. They're using untested strategies, or strategies they tested but don't trust enough to follow when things get uncomfortable.
Backtesting gives you three things:
Validation. Does your strategy actually have a statistical edge? How does it perform across different market conditions? What's the worst drawdown you should expect? These aren't guesses after backtesting. They're data.
Confidence. After placing hundreds of trades on historical data, you know your strategy's rhythms. You've seen the losing streaks. You've watched the recoveries. When a drawdown happens in live trading, it's not a surprise. It's familiar.
Discipline. Manual backtesting in particular forces you to practice your execution. You learn to follow your rules, resist the urge to deviate, and build the muscle memory for consistent trading.
How to Backtest Step by Step
Step 1: Define Your Strategy Rules
Before you test anything, write down your strategy in clear, specific terms:
What are your entry conditions? What indicators, price action patterns, or signals trigger a trade?
What are your exit conditions? Where do you set your stop loss and take profit? Do you use a trailing stop?
What timeframe do you trade on? 1-minute, 15-minute, 1-hour, daily?
What instruments do you trade? Specific forex pairs, indices, crypto, commodities?
The more specific your rules, the more meaningful your backtest will be.
Step 2: Choose Your Data
The quality of your backtest depends entirely on the quality of your data. Bad data produces misleading results.
Look for clean historical data, data that's been processed to remove anomalies like price spikes, bad ticks, and gaps from connectivity issues. These artifacts can trigger phantom trades that would never happen in live markets.
ChartLabs sources data from Dukascopy, tick-level where it is available, and cleans it to remove anomalies before building 1-minute candles. How far back the history goes depends on the symbol: up to around 22 years on the oldest forex pairs, with indices, crypto, and commodities starting later.
Step 3: Start Testing
With manual backtesting, you step through historical data candle by candle:
Open your chart at a starting point in history. Let the data play forward. When your strategy signals an entry, place the trade, just like you would in live markets. Set your stop loss and target. Watch how the trade plays out.
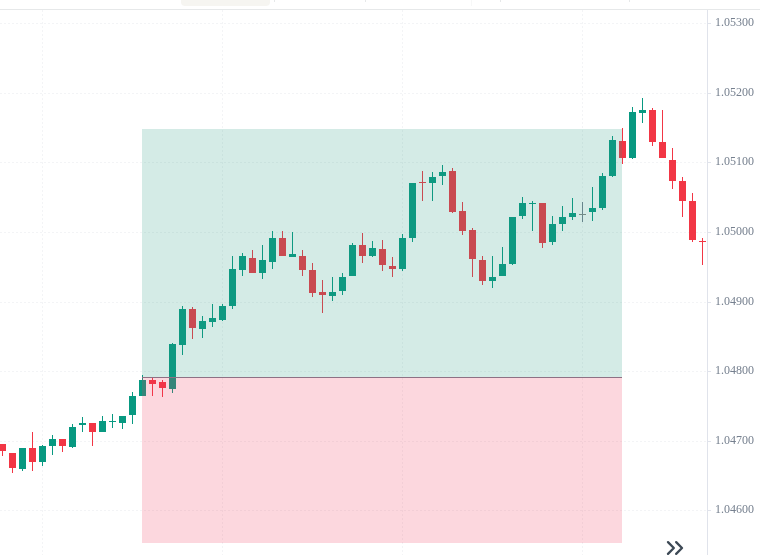
Keep going. Place trade after trade. Don't skip setups. Don't change your rules mid-test.
The goal isn't just to see if the strategy is profitable. It's to experience what trading this strategy feels like: the wins, the losses, the drawdowns, the recoveries.
Step 4: Track Everything
Every trade should be logged with details: entry price, exit price, direction, profit or loss, and any notes about why you took the trade.
Good backtesting platforms handle this automatically. ChartLabs logs every trade with full analytics, saves chart snapshots of every trade entry, and lets you tag trades for later filtering.

Step 5: Analyze Your Results
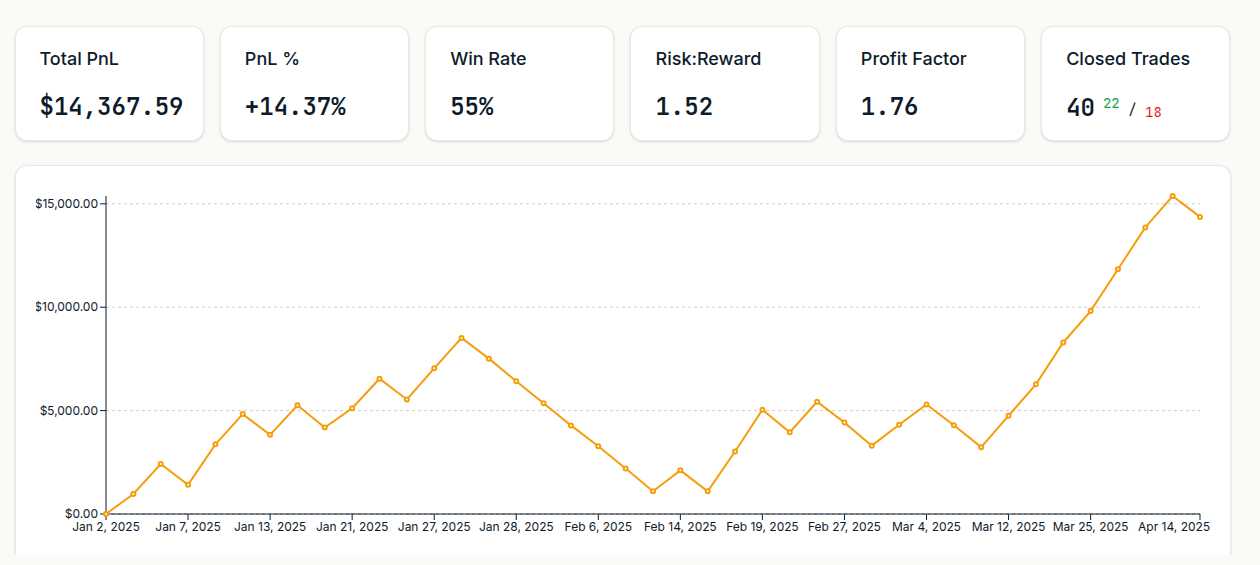
After enough trades (aim for at least 100-200 for statistical significance), review your performance:
Win rate. What percentage of trades were profitable?
Profit factor. Total profit divided by total loss. Above 1.0 means profitable overall.
Maximum drawdown. The largest peak-to-trough decline. This tells you the worst losing period you should expect.
Risk-adjusted returns. Metrics like Sharpe ratio, Sortino ratio, and Calmar ratio tell you how much return you're getting per unit of risk.
Timing patterns. Do certain days of the week or hours perform better? Are there periods your strategy consistently struggles?
Step 6: Refine and Repeat
If your backtest reveals weaknesses, adjust your strategy and test again. Use trade tags and filters to isolate which setups work best and which ones drag down your performance.
This iterative process of test, analyze, refine, retest is how strategies get polished before they ever see real money.
Common Backtesting Mistakes
Not enough trades. A 20-trade backtest is meaningless statistically. Aim for 100+ trades minimum.
Changing rules mid-test. If you keep adjusting your strategy while testing, you're not testing a strategy. You're curve-fitting to historical data.
Ignoring losing streaks. Every strategy has them. If you can't stomach the drawdowns in backtesting, you won't survive them live.
Using bad data. Free data from brokers often contains anomalies that produce unrealistic results. Invest in clean data.
Skipping manual practice. Even if you've validated your strategy with automated backtesting, manual practice builds the execution skills you need for live trading.
Getting Started
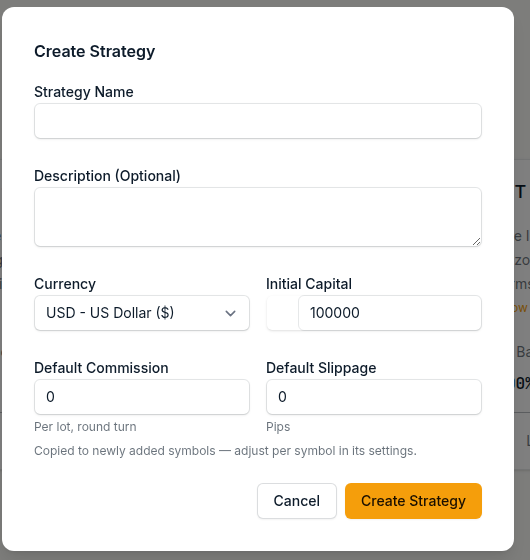
ChartLabs makes manual backtesting straightforward. Create a strategy, choose your symbols and timeframe, and start stepping through data. Every trade is logged automatically. Every chart is snapshot at the point of trade. Full analytics are included: equity curve, Monte Carlo simulation, risk-adjusted returns, timing insights, and more.
One plan, $20/month or $200/year. 7-day free trial, no credit card required.
Start at chartlabs.io.