What Is a Tasuki Gap? The Three-Candle Pattern Rules
What is a tasuki gap? Two same-colour candles with a gap between them, then an opposite candle that tests the gap and fails to close it.
A tasuki gap is a three-candle continuation pattern. Two candles of the same colour print a gap between them in the direction of the trend, and then an opposite-colour candle opens inside the second body and pushes back into the gap without closing it.
The upside tasuki gap forms in an uptrend, with two white candles and a black third. The downside tasuki gap is the mirror in a downtrend, with two black candles and a white third. Both halves are one pattern with the sign flipped, which is why the TA-Lib library covers them with a single rule whose direction comes from the colour of the gapping candle.
Two choices decide whether you can count the pattern at all: what counts as the gap, and what exactly the third candle has to do. Published definitions answer each of them more than one way, and the readings are far apart. On the same eight months of EURUSD 15-minute data, the two gap definitions return 736 setups and 8. Hold the gap definition fixed and change only the third-candle rule, and three published readings return 2, 378 and 727.
What does tasuki mean?
It is a garment. LuxAlgo gives the origin as "A tasuki is a Japanese sash used to hold back kimono sleeves", with the crossing shape of the third candle against the gapped pair suggesting the name. WR Trading says the same thing in its own words. The name describes the picture and carries no rule inside it.
What counts as the gap in a tasuki gap?
Two different things, and none of the definitions presents it as a choice you have to make.
The first reading is a gap between the two bodies: candle 2 opens above candle 1's close, written open(2) > close(1). This is what TA-Lib means when it calls the second candle real-body-gapping, and it is what LuxAlgo means by "a real gap between their bodies". Candle 1's upper wick may still cover that ground, so there may be no untraded price at all.
The second reading is a gap clear of candle 1's whole range: candle 2's low sits above candle 1's high, written low(2) > high(1). This is ForexBee's requirement that candle 2 "will open with a gap up and outside the range of the previous candlestick". Here there genuinely is a band of price nobody traded.
The two populations are not close. Counted on our one-minute data from Dukascopy, cleaned to remove anomalies and aggregated into higher timeframes, eight months to 31 August 2026, upside setups only (two white candles, black third):
| Timeframe | Bars | Body gaps | Gaps clear of candle 1's range |
|---|---|---|---|
| EURUSD M15 | 16,520 | 736 | 8 |
| EURUSD H1 | 4,130 | 201 | 1 |
| EURUSD H4 | 1,068 | 44 | 1 |
| EURUSD D1 | 208 | 10 | 0 |
| German index, M15 | 15,181 | 1,015 | 32 |
| German index, D1 | 207 | 15 | 1 |
Body gaps are ordinary. A true untraded gap in a 24-hour market is not, which is the point LuxAlgo makes without a number: "In 24-hour markets, strict tasuki gaps are scarce because true gaps rarely form".
What must the third candle do?
Three published answers. Holding the gap at the body-gap reading, so that only the third-candle rule changes, they return 2, 378 and 727 out of the same 736 EURUSD M15 setups.
TA-Lib and LuxAlgo want the third candle to open inside candle 2's body and close back inside the gap. The library's summary is "a real-body-gapping candle followed by an opposite-color candle that opens inside its body and closes back into the gap without filling it", and LuxAlgo's third step asks you to "Require the third candle to be the opposite color, open within the second candle's body, and close inside the gap". That is the strictest reading, and it fires 2 times.
ForexBee relaxes where the close has to land. Its third-candle rule is that it "must open within the range of the previous candlestick and close above the closing price of the first candlestick". Opening in candle 2's range rather than its body is looser, and a close anywhere above candle 1's close qualifies rather than a close inside the gap. That fires 378 times.
FXOpen drops the opening requirement altogether. Its third candle merely "partially closes the gap" for the upside version, and for the downside version "closes within the gap but does not fully cover it". With no condition on where the third candle opens, that fires 727 times, which is almost every body-gapped pair there is.
Three readings of one pattern, 2 against 727.
Does ChartLabs mark the tasuki gap?
Yes, on the strict reading. Tasuki Gap is one of the 61 pattern switches inside our Candlestick Patterns indicator. Open the chart's Indicators menu, find the Patterns heading in the Standard list, and add the entry called Candlestick Patterns. It draws on the price pane next to your candles rather than in a pane of its own, and the Tasuki Gap switch is already on when you add it, so there is nothing to turn on first.
The mark is the short code TG on the third candle: below the low for an upside gap, above the high for a downside one. Every pattern in that indicator is placed the same way, bullish codes under the bar's low and bearish or neutral ones over its high. One switch covers both directions, with the sign taken from the colour of the gapping candle.
Upside/Downside Gap Three Methods has a switch of its own in the same indicator, marked G3M and also on by default, so the pattern that fills the gap and the pattern that defends it show up as two different codes on your chart rather than as one judgement call.
Does a filled gap cancel a tasuki gap?
Yes. LuxAlgo's fourth step is "Verify the gap is not fully closed; a complete gap fill invalidates the pattern", and its FAQ names a complete fill as the one thing that invalidates the setup. The library builds the same condition into its summary with the words "without filling it".
One published rule set permits the filled gap anyway. Take ForexBee's three conditions exactly as written, including its requirement that candle 2 open clear of candle 1's range, and they can all be true while the gap is traded straight through. A constructed example with round numbers, not a real chart:
| Candle | Open | High | Low | Close |
|---|---|---|---|---|
| 1, white | 1.1000 | 1.1060 | 1.0995 | 1.1050 |
| 2, white | 1.1075 | 1.1090 | 1.1070 | 1.1085 |
| 3, black | 1.1080 | 1.1082 | 1.1040 | 1.1055 |
Candle 2 opens at 1.1075, above candle 1's high of 1.1060, so the gap requirement is met and the untraded band runs from 1.1060 to 1.1070. Candle 3 opens at 1.1080, inside candle 2's range. Candle 3 closes at 1.1055, above candle 1's close of 1.1050. All three published conditions hold. And yet candle 3 traded down to 1.1040 and closed at 1.1055, both below the gap's floor of 1.1060, so the untraded band is gone.
How often does that happen in practice? Less often than the loophole suggests. Applying ForexBee's complete rule set, gap requirement included, it fires 7 times on EURUSD M15, and in none of those 7 did the third candle close at or below candle 1's high. On the German index it fires 27 times at M15 with 1 such case, and once at H4, which was also such a case. So the rules allow a state the same page says voids the pattern, and the state does occur, just rarely.
Separately, if you take ForexBee's third-candle clause but accept the looser body-gap definition, 145 of the 378 hits close at or below candle 1's high. At H1 it is 38 of 101, at H4 12 of 20, at D1 3 of 6. That combination is nobody's published pattern, which is why the two choices have to be written down together rather than mixed.
Can a tasuki gap happen in forex?
The body-gapped pair is common and the completed strict pattern is close to absent. Under the strictest published combination, a gap clear of candle 1's whole range plus a third candle closing inside that untraded band, the completed upside tasuki gap appears 0 times in our eight months. That is 0 on EURUSD at M15, H1, H4 and D1, and 0 on the German index at all four, across 246,778 and 225,951 one-minute bars before aggregation.
Relax the gap to the body reading and the library's third-candle rule gives 2 at M15, 2 at H1, 1 at H4 and 0 at D1 on EURUSD, and 13 at M15 on the index. An instrument that pauses for about an hour each evening produces more of them, but not many more.
LuxAlgo already says the strict form is rare, writing that "the pattern is uncommon in strict form". The counts put a size on it.
Eight months of daily bars is 208 and 207 rows, so a zero on daily data covers 208 days and nothing longer. And the rarity sits in the third candle rather than in the gap: there were 736 body-gapped pairs on those 16,520 M15 bars.
Which rule set should you adopt?
One of them, whole. Mixing a gap test from one definition with a third-candle rule from another produces a pattern nobody published.
| Rule set | The gap test | The third candle | Setups on EURUSD M15, January to August 2026 |
|---|---|---|---|
| TA-Lib and LuxAlgo | Body gap, open(2) > close(1) | Opens inside candle 2's body, closes inside the gap, no full fill | 2 |
| ForexBee | Candle 2 clear of candle 1's range, low(2) > high(1) | Opens in candle 2's range, closes above candle 1's close | 7 |
| FXOpen | A gap up, with no formal test, so the body gap stands in | Closes partly into the gap, with no condition on where it opens | 727 |
TA-Lib adds a caveat that applies whichever row you pick: its rule does not check the prior trend the pattern classically assumes, so you have to confirm the trend yourself.
How do you test a tasuki gap step by step?
Pick your two rules and write them down before you count anything, because those two choices and not the market decide how many instances you find.
- Choose the gap definition:
open(2) > close(1)for the body gap, orlow(2) > high(1)for a gap clear of candle 1's range. Write which one down. - Choose the third-candle rule from the three above. Write that down too, including where the third candle must open.
- Choose the instrument and timeframe and fix them for the whole test. The counts above move by an order of magnitude between M15 and D1 on the same months, so a timeframe you change halfway through makes the log unreadable.
- Step through history one bar at a time with the next bar hidden. The premise of this pattern is whether a later bar fills the gap, so a method that lets you see the future answers the question before you have asked it.
- When a gapped pair appears, mark the gap's top and bottom before the third candle resolves.
- Apply your third-candle rule exactly as written. If the close lands outside what your rule allows, it is not an instance, however much it looks like one.
- Charge yourself costs on anything you trade. Commission and slippage are applied per symbol, so the P&L reflects what trading actually costs.
- Repeat on a date range you have not studied.
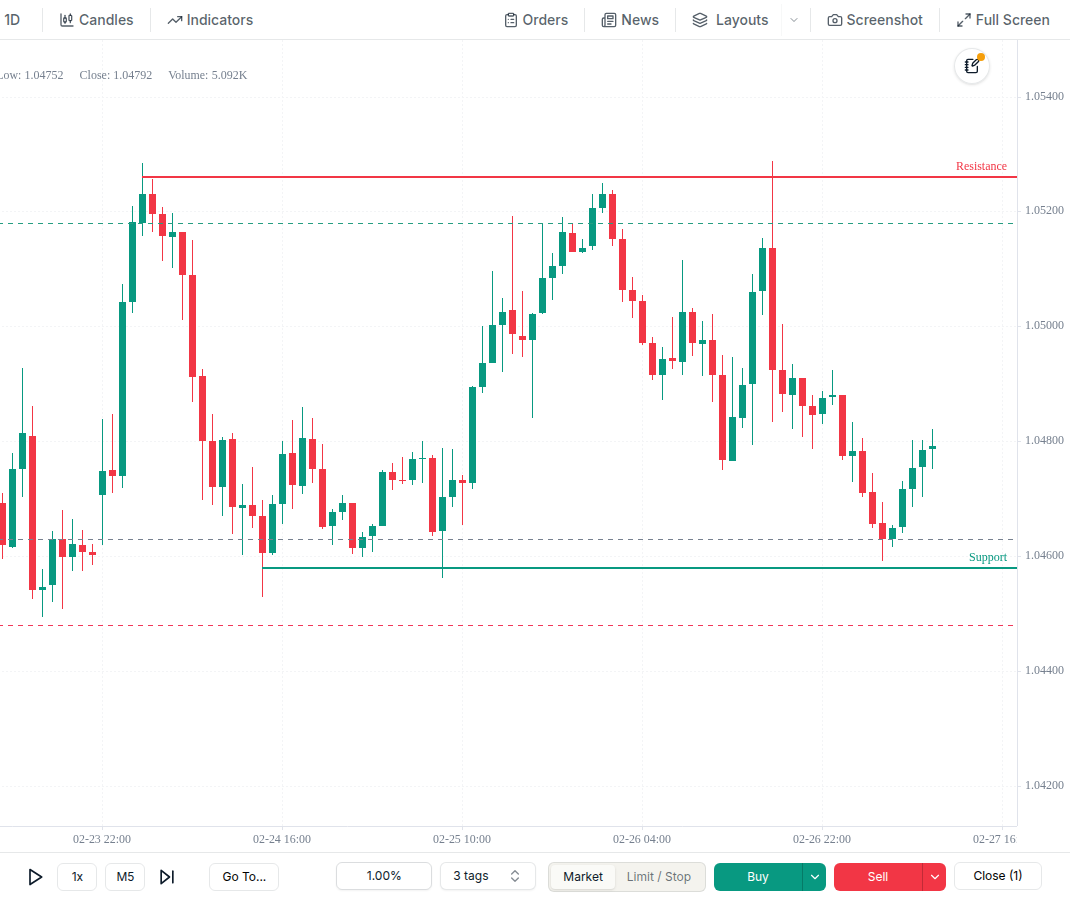
If you would rather have the rule computed than judged by eye, the TG switch computes TA-Lib's version of it: a gap between the bodies of candles 1 and 2, a third candle of the opposite colour that opens inside candle 2's body and closes inside the gap without closing it, and bodies of similar size on candles 2 and 3, on TA-Lib's default thresholds, which you cannot change.
For a different gap definition or third-candle rule, write your own as an indicator in the built-in Pine Script editor. "Example: Mark bars by a rule" on the Pine Scripts tab opens a copy you can adapt, and a script can mark the chart where your rule fires, with a shape or a label on the bar, so your gap definition and your third-candle rule show up as marks instead of judgement calls bar by bar. There is no scanner and no price alerts, and the named-shape drawing tools we ship are the wave and harmonic ones under Wave Tools, XABCD Pattern, ABCD Pattern, 3-Wave Pattern, 5-Wave Pattern, 8-Wave Pattern and Any Wave Pattern, which you place by hand. There is no Pine backtesting either, so the marks show where a rule fires while you step the bars and place the trades yourself.
What should you record for each one?
The parameters, not just the outcome, because two counts are not comparable if a rule changed between them.
- The gap's top and bottom as prices, and which of the two gap definitions produced them.
- Whether the third candle's low entered the gap.
- Whether the third candle's close stayed inside the gap, or landed above or below it.
- Which third-candle rule you were applying, named.
- Whether a later bar filled the gap, and how many bars it took.
- The instrument and timeframe.
Each trade in ChartLabs carries a note field, and the notes come through in the trades CSV export, so the rule version travels with the trade instead of living in your memory. You can also tag trades as you go and filter the analytics by tag, which keeps instances found under one rule separate from instances found under another.

How is a tasuki gap different from a runaway gap, mat hold or three methods?
By what gets tested and when.
A runaway gap "is a mid-trend gap classified by its position in the move", as LuxAlgo puts it, so it is named for where it sits rather than for any three-candle script. The tasuki gap adds the script in which the gap is tested and defended immediately.
A mat hold "also opens with a gap in the trend direction, but its pullback lasts several small candles before continuation", where the tasuki gap settles the test in a single third candle. The library's mat hold rule also carries a penetration parameter, a maximum fraction of the first white body the reaction candles may penetrate, and the tasuki gap has no equivalent.
Rising and falling three methods has no gap in it at all. LuxAlgo describes it as "a multi-bar countertrend drift contained within one large candle's range, with no gap involved".
An upside gap three methods is the near neighbour that does fill. WR Trading puts the distinction cleanly: "unlike the upside Tasuki gap third candle that partially fills up the gap, the upside Gap 3 Methods completely fills up the gap."
How large a move has to be to count as a gap, and whether gaps fill in general, is a bigger subject than this pattern.
Related reading
- Forex backtesting, for session and pair effects on a count like this one.
- Backtesting accuracy, slippage and data quality, for why the data under a pattern count matters.
- Clean forex historical data, for where the one-minute bars behind the figures above come from.
- Trading simulator, for the bar-by-bar part.
Next step
Write down one gap definition and one third-candle rule, then count them yourself on history you have not studied. Start your free trial: 7 days, no credit card, one plan at $20 a month or $200 a year.
Related Topics
Related
Forex Backtesting: Test Your Strategy on Real Data
A practical guide to backtesting forex strategies: why session dynamics, spread variation, and pair-specific behavior change your results, what clean historical data actually means, and a five-step process for testing a strategy before you risk real capital.
Backtesting Accuracy: How Slippage and Data Quality Matter
Why backtest results and live results drift apart, and what actually closes the gap: clean tick data, honest spread assumptions, and commission and slippage modelled directly on every trade you log.
Clean Forex Historical Data on ChartLabs: Source, Cleaning, and Depth
Where ChartLabs historical data comes from, how we clean it, and how far back it goes. Sourced from Dukascopy at tick level where available, cleaned to remove anomalies, and built into 1-minute candles. Depth is per symbol: the oldest forex pairs reach back around 22 years, other instruments start later.