What Is Rising Three Methods? And Falling Three Methods
What is rising three methods? Five candles: a long one, a three-candle pause held inside it, then a long one resuming the trend, with counts.
Rising three methods is a five-candle continuation pattern: one long candle in the direction of an uptrend, then three small candles that drift back against it while staying inside the first candle's range, then another long candle that resumes the trend. Falling three methods is the exact mirror in a downtrend, with a long dark candle, three small rising candles, and a long dark candle that resumes the fall.
There is no gap anywhere in this pattern. That one fact separates it from the mat hold, which looks similar and opens its pause with a gap.
Two of the five candles are defined differently almost everywhere you look. What "stays inside the first candle" means has four published readings. We counted three of them on the same 24 EURUSD 15-minute frames, and they return 5, 12 and 24; the fourth, which tests the closes alone, is not in our table. What the fifth candle has to close above has five readings, plus an opening condition one source adds. Until you have picked one of each, you cannot count a single occurrence.
What are the five candles?
A long candle, a three-candle pause, a long candle. In order, for the rising version:
- A long white candle in an established uptrend.
- Three small candles, classically black, that drift lower and stay inside candle 1.
- A long white candle that resumes the trend.
The falling version swaps every colour and direction. TA-Lib treats them as one rule, marking the pattern bullish or bearish by candle 1's colour, and most explainers present both halves together, which is why they belong on one page.
No candle in this pattern gaps away from its neighbour. And none of the definitions publishes a number for "long" or "small".
What does "stays inside the first candle" mean?
Four published answers, and they are different tests rather than different wordings.
Inside candle 1's high-low range, wicks included. LuxAlgo's second step asks that the middle candles "hold within the first candle's high-low range, drifting against the trend". Chart-Formations states the same test as a pair of levels: "none of the smaller candlesticks should make a higher high or a lower low than the first candlestick." Alphaex Capital describes the practical way to check it: "I draw the first candle's high and low as lines and reject any instance where the three middle candles cross them, because the lines turn a judgment call into a yes-or-no check."
Containment by close only. Alphaex Capital also states the rule a second way, twice: the pattern is invalid "if any of them closes outside it", and again "If any of the three small candles closes above the first candle's high or below its low". A middle candle whose wick pokes out but whose close stays inside passes this version and fails the one above.
Only partial overlap. TA-Lib's note is the opposite of what most explainers call the defining rule, and it says so plainly: "The middle candles need only partially overlap the first candle's range, not be fully contained within it."
Inside candle 1's body. LiteFinance requires a first candle "that completely encompasses all three candles within its body", which is the strictest of the four, because a body is narrower than a range and the middle candles' wicks have to fit inside it too.
What three of them cost on the same frames, from our own data, sourced from Dukascopy and cleaned to remove anomalies, one-minute candles aggregated upward, eight months to 31 August 2026, rising half only:
| Frames (long candle 1, three small black, long white candle 5) | Inside the range | Inside the body | Partial overlap |
|---|---|---|---|
| EURUSD M15, 24 frames | 5 | 12 | 24 |
| EURUSD H1, 7 frames | 1 | 6 | 7 |
| EURUSD H4, 2 frames | 1 | 2 | 2 |
| German index M15, 27 frames | 5 | 12 | 26 |
The middle column looks wrong at first glance. A body sits inside a range, so how can body containment find more instances than range containment? Because the two columns do not measure the same thing.
Our range test asks whether each middle candle fits inside candle 1 from its own high down to its own low, wicks included. Our body test asks only whether each middle candle's body fits inside candle 1's body, and ignores wicks on both sides. So a middle candle with a long wick can have its body tucked well inside candle 1's body while that wick pokes above candle 1's high. It passes the body test and fails the range test, and those candles are the extra seven instances at EURUSD M15.
That has a consequence for the figure. Because our body test ignores wicks, it is looser than LiteFinance's own sentence, which asks for all three whole candles inside the body. A test written the way LiteFinance writes it would be stricter than either column. So 12 is a ceiling on LiteFinance's reading rather than a count of it.
It also means the table cannot settle a point LuxAlgo's FAQ raises, which is worth quoting because it is the one place the choice is presented as a choice: "The standard requirement is containment within the first candle's high-low range, not its body. Some strict readings prefer body containment, which makes the pattern rarer and arguably cleaner." Our two columns are not the same test run twice, so 12 against 5 is not evidence either way about that.
Partial overlap clears all 24 EURUSD M15 frames and 26 of the 27 on the index, which is what you would expect: three candles immediately following a long one almost always touch its range somewhere.
What must the fifth candle close above?
Five published answers, and one source also wants it to open somewhere particular.
| Reading | Who publishes it |
|---|---|
| Above candle 1's close | TA-Lib, LuxAlgo, Chart-Formations |
| Above candle 1's high | Alphaex Capital, crediting Nison |
| Above the pattern's highest high | The Robust Trader |
| Above candle 1 and candle 2 both | HowToTrade |
| For the falling half, below the low of the first four candlesticks | LiteFinance |
| Plus: opening above the preceding small candle's close | Chart-Formations only |
Two of those are the same test more often than they look. Under range containment no middle candle can print above candle 1's high, so the pattern's highest high through candle 4 is candle 1's high, and "above candle 1's high" and "above the pattern's highest high" become one condition. They only separate once containment is relaxed enough to let a middle candle poke above candle 1.
What our data says about the fifth candle is narrow. Under range containment, all four of the rising-half readings complete 0 times: every timeframe, both instruments, eight months. A pause that stays strictly inside candle 1 is never followed by a qualifying resolution candle in this sample. Because all four are zero there, these counts cannot separate the fifth-candle rules from each other.
The one place the containment choice shows its price is the mildest fifth-candle rule, a close above candle 1's close. That gives 4 under partial overlap and 1 under body containment on EURUSD M15, and 7 and 2 on the index.
We varied the fifth-candle rule only inside range containment, where everything is zero, and varied containment only for one fifth-candle rule. What each of the other fifth-candle readings costs under looser containment is not measured here.
Does it have to be exactly three middle candles?
In the strict description yes, in practice no, and this is the one place where relaxing a rule creates occurrences instead of removing them.
TA-Lib detects only the three-candle form and says so: "Only the three-small-candle variant is detected; the classic pattern allowing two or more small candles is not supported." LuxAlgo's second step allows "classically three, practically two to five", and its FAQ repeats that "most modern references and scanners accept two to five small counter-trend candles". Chart-Formations agrees from the other direction: the pause "could be two or more candlesticks, though three is the most common number".
Counted with range containment and a fifth candle closing above candle 1's close, the pause length changes everything:
| Middle candles | EURUSD M15 | EURUSD H1 | German index M15 |
|---|---|---|---|
| 2 | 4 | 2 | 9 |
| 3 | 0 | 0 | 0 |
| 4 | 0 | 0 | 0 |
| 5 | 0 | 0 | 0 |
The two-candle pause is the one that occurs here. So on these bars, every instance a two-to-five scanner would hand you is the two-candle version, and that is a different shape from the one the name describes.
Does ChartLabs mark rising and falling three methods?
Yes, and it is one switch rather than two. Rising/Falling Three Methods is a single entry among the 61 pattern switches inside our Candlestick Patterns indicator, covering both halves with the sign taken from the first candle's colour, the way TA-Lib does it. Open the chart's Indicators menu, find the Patterns heading in the Standard list, and add the entry called Candlestick Patterns. It draws on the price pane next to your candles rather than in a pane of its own, and the switch is already on when you add it.
The mark is the short code R3M on the fifth candle, below the low for the rising version and above the high for the falling one. Every pattern in that indicator is placed that way: bullish codes under the bar's low, bearish and neutral ones over its high. In the indicator's settings the switch sits under "Four- and five-candle patterns", which is where to go if you want it off again.
How small is "small" and how long is "long"?
None of the definitions puts a figure on how long candle 1 must be or how small the middle candles must be, which means every published count of this pattern rests on an unstated threshold.
Ours, stated so you can disagree with them: candle 1's body at least 1.5 times the mean body of the previous 20 bars, and each middle candle's body at most 0.5 times candle 1's body. Those are what we measured with. They are not a recommendation, and a different pair is not wrong.
The zeros above are not an artefact of those two numbers. We ran sixteen combinations per timeframe, candle 1 at 1.0, 1.2, 1.5 and 2.0 times the previous twenty, against middle bodies at 0.3, 0.5, 0.8 and 1.0 times candle 1. On 208 EURUSD daily bars the completed strict pattern appears 0 times in all sixteen. On 16,520 EURUSD 15-minute bars the highest it ever reaches is 2. The frames themselves are not the constraint: at the loosest setting there are 104 of them at M15. Containment is what removes them.
Keep the window attached to the number, though. Eight months is 208 EURUSD daily bars and 207 on the index, so a zero on daily data covers 208 days and nothing longer.
Our frame count is stricter than two of the definitions in one respect worth naming: we require all three middle candles to be black. Alphaex Capital explicitly allows bullish ones, saying "Small bullish middle candles can still count as long as they stay contained", and Chart-Formations says the pause "could include one or two light-colored candlesticks". Allowing those would raise every frame count above.
LuxAlgo and LiteFinance both say the strict form is rare already. LuxAlgo writes that "the strict form, with exactly three contained candles, is uncommon" and again that "strict five-bar instances are rare". LiteFinance is blunter: "The ideal Falling Three Methods pattern almost never occurs." The counts above put a size on that under a stated rule.
Which rule set should you adopt?
One of them, whole. The disagreements above run inside single definitions as well as between them. Several state their own rules two different ways, so a rule copied off a summary line can contradict the detail further down the same page. Read a definition to the end before you adopt it, then write down the version you took.
A few facts to pick between, each from the definition that publishes it:
- TA-Lib is the loosest on containment, needing only partial overlap, and it detects the three-candle form only.
- LiteFinance is the strictest, asking for all three middle candles inside candle 1's body, and it adds a ceiling nobody else has: the third pause candle "must not close above the first candle's open".
- Chart-Formations is the only one that puts a condition on where candle 5 opens, above the close of the small candle before it, and the only one that places the pattern historically, as "part of Sakata's Five Methods".
- Alphaex Capital is the only one that asks candles 1 and 5 to be of "similar size".
- LuxAlgo and Chart-Formations both allow a pause of two or more candles rather than exactly three, which, on the counts above, is the choice that moves your results furthest.
TA-Lib also carries a caveat that applies whichever set you pick: "The prior trend the continuation reading assumes is not verified."
How do you test rising three methods step by step?
Write down three choices before you open a chart, because those three and not the market decide how many instances you find.
- Choose a containment rule: whole candles inside candle 1's range, closes only, bodies inside the body, or partial overlap. Name it.
- Choose a fifth-candle rule from the five above, and say whether you also require the opening condition.
- Choose how many middle candles count: exactly three, or two to five. Given the table above, this changes your count more than anything else.
- Pick your own thresholds for long and small, write them down, and do not change them mid-count.
- Fix the instrument and timeframe for the whole test. The counts above move by an order of magnitude between M15 and D1 on the same months.
- Step through history one bar at a time with the next bar hidden. The pattern is not complete until candle 5 has closed, so a method that shows you candle 5 while you are judging candle 3 is not a test.
- Charge yourself costs on anything you trade. Commission and slippage are applied per symbol, so the P&L reflects what trading actually costs.
- Repeat on a date range you have not studied.
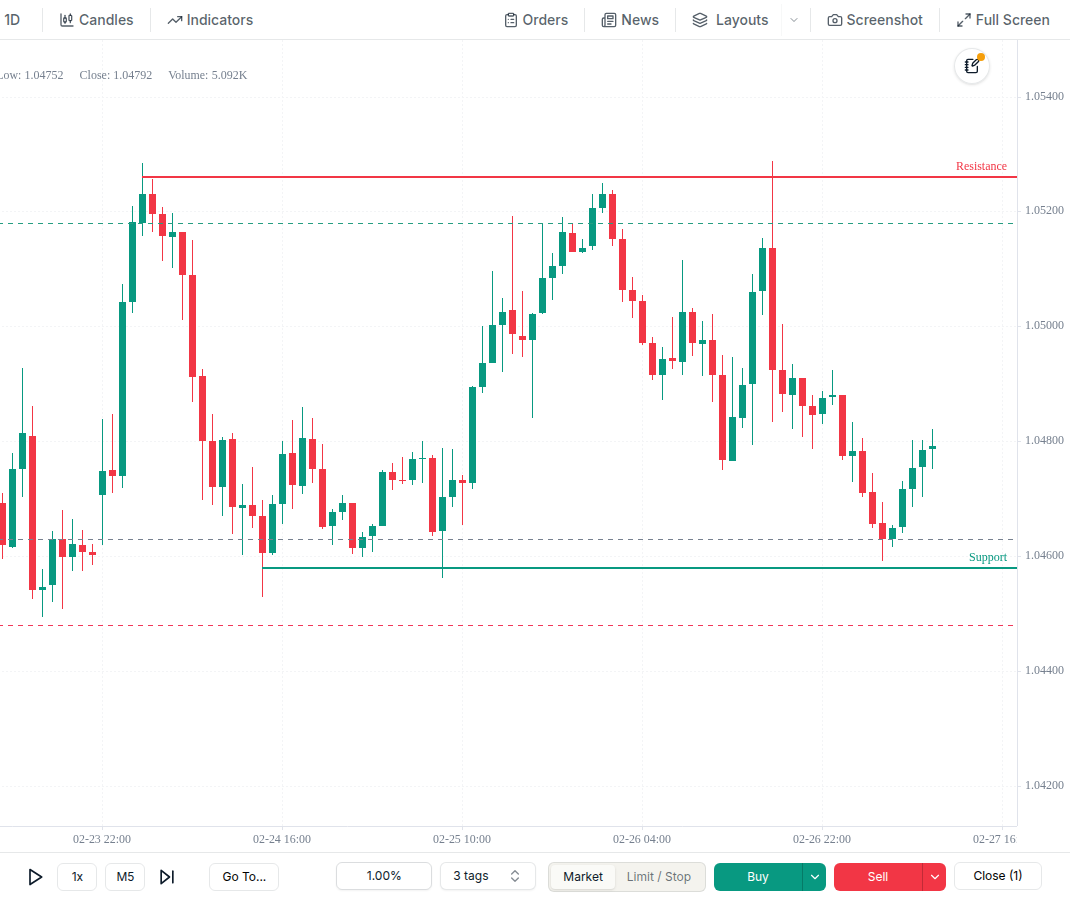
Three rule choices and two thresholds is a lot to hold in your head on every frame. Our R3M switch takes TA-Lib's answer to all of them, so it finds only the three-small-candle form, on TA-Lib's default thresholds, which you cannot change.
For a different combination, write it as an indicator in the built-in Pine Script editor. "Example: Mark bars by a rule" on the Pine Scripts tab opens a copy you can adapt, and a script can mark the chart where your rule fires, with a shape or a label on the bar, so the containment rule and the fifth-candle rule you chose show up as marks instead of five judgement calls per frame. There is no scanner and no price alerts. The drawing tools that come with named shapes built in are the harmonic and wave ones, XABCD Pattern, ABCD Pattern, 3-Wave Pattern, 5-Wave Pattern, 8-Wave Pattern and Any Wave Pattern under Wave Tools, and a five-candle template is not among them. Pine has no backtesting either, so the marks tell you where a rule fired, and you still step the bars and place the trades.
What should you record for each occurrence?
The parameters, because a count taken under one combination cannot be compared with a count taken under another.
- Candle 1's open, high, low and close, as prices.
- Which containment rule the pause satisfied, and whether any middle candle's wick left the range.
- What candle 5 actually closed above, as a level and not as a label.
- How many middle candles there were.
- The two thresholds you used for long and small.
- The instrument and timeframe.
Each trade in ChartLabs carries a note field, and the notes come through in the trades CSV export, so the rule version stays attached to the trade. You can tag trades as you go and filter the analytics by tag, which keeps one combination's instances apart from another's.

Is rising three methods the same as a bull flag?
Nearly, and the difference is the bar count. LuxAlgo puts it as "candlestick language for the same behavior Western charting calls a flag, compressed into a fixed five-bar template", and Chart-Formations says the pattern "is similar to the Western Flag or Pennant formations".
A flag has no fixed number of bars and is drawn with trendlines, so two people can mark the same consolidation as a flag and disagree only about where the lines go. Three methods fixes the count at five and replaces the lines with a containment test. That makes it easier to count and much rarer.
The mat hold is the other near neighbour, and one sentence settles it. LuxAlgo: "The mat hold opens its pause with a gap up and tolerates a slightly deeper dip; the three methods keeps the pause fully inside the first candle's range with no gap." TA-Lib's mat hold rule also carries a penetration parameter, a maximum fraction of candle 1's body the reaction candles may enter, and three methods has no equivalent.
Related reading
- Forex backtesting, for how session and pair choices move a count like this.
- Manual vs automated backtesting, for which one answers which question about a rule set.
- Backtesting accuracy, slippage and data quality, for why the data under a pattern count matters.
- Trading simulator, for the bar-by-bar part.
Next step
Pick one containment rule, one fifth-candle rule and one pause length, write all three down, and count them on history you have not studied. Start your free trial: 7 days, no credit card, one plan at $20 a month or $200 a year.
Related Topics
Related
Forex Backtesting: Test Your Strategy on Real Data
A practical guide to backtesting forex strategies: why session dynamics, spread variation, and pair-specific behavior change your results, what clean historical data actually means, and a five-step process for testing a strategy before you risk real capital.
Manual vs Automated Backtesting: Which One Should You Use?
Automated backtesting tells you whether a set of rules made money. Manual backtesting tells you whether you can trade them. A practical comparison of what each one tests, what it costs you in time and skill, and which to reach for first.
Backtesting Accuracy: How Slippage and Data Quality Matter
Why backtest results and live results drift apart, and what actually closes the gap: clean tick data, honest spread assumptions, and commission and slippage modelled directly on every trade you log.