Multiple Time Frame Analysis: How Many and Which Ones
Multiple time frame analysis: how many time frames to use, which ones pair up, and how to settle the combination on your own history rather than copy one.
Use two charts, and read the slower one first. For a swing trade that is the daily paired with the 4-hour; for a day trade it is whichever pair matches how long you actually hold, because the published day-trading answers run from the daily down to the 30-minute and describe quite different holding times under one name.
Multiple time frame analysis means reading one instrument on more than one chart period at once, using the slower chart for direction and the faster one to time the entry. Two or three periods is the practical range. A third chart is worth adding once you can say what it would stop you doing.
How many time frames should you use?
Two, if you want a count you can test and stick to. Most published advice says three, and the one page that reasons about the number instead of asserting it refuses to give one at all.
The three-chart version splits the view into long, medium and short term. Benzinga's FAQ states it as a recommendation: "It's recommended you use three time frames (long-term, medium-term and short-term) to gain a comprehensive understanding of market trends, confirm signals and optimize trade entries and exits." Real Trading gives the argument for it, that a third chart confirms whether a trend is really forming: "By looking at at least three timeframes, you will be in a good position to confirm whether the trend is indeed forming."
Tradeciety goes the other way, recommending "keeping it simple, especially in the beginning, and limiting it to two timeframes that you use in your trading". OANDA declines a number outright: "Deciding how many timeframes to use is up to the trader's needs as well as the instrument being traded; there is no set number".
OANDA then explains what the count should depend on. A currency pair with higher volatility may want four or five periods and a calmer one two or three, and holding time matters as much, since "a long-term trader may need only two time frames". So the question is how fast your market moves and how long you hold.
Two is the better place to start. The failure mode in this method is changing the combination before the log can say anything, and every extra chart multiplies the ways a rule can be fudged after the fact. Tradeciety also pairs its count with a discipline rule: pick one combination and stay with it, which it quantifies in two places, "for at least 30 trades" and "at least 30 to 50 trades".
Which time frames go together?
For swing trading, the daily paired with the 4-hour. That combination turns up in two separate places. Below it the answers diverge sharply.
| Style | Charts named |
|---|---|
| Swing | 4-hour and daily |
| Swing | Daily, 4-hour, 1-hour |
| Day trading | Daily, 4-hour, 15-minute |
| Day trading | 5-minute, 15-minute, 30-minute |
| Scalping | 4-hour, 1-hour, 15-minute |
| Long term | Daily, 4-hour, 1-hour |
Both swing answers contain the daily and the 4-hour and differ only on whether a third chart joins. The two day-trading answers share the 15-minute and part company at the top: one starts at the daily, the other at the 30-minute. About a day of price sits between those two highest charts, which is why reading both as advice about the same activity is a mistake. They describe different holding times under one label.
The longest list of pairings runs six rows, from weekly with daily down to 1-hour with 1-minute. It offers four distinct higher charts, since the daily and the 1-hour each appear twice. Count the rows and the higher charts separately before treating that as six real choices.
Whatever you pick, every published sequence starts at the slowest chart and works down. OANDA puts the reason plainly: "regardless of which timeframe the trades are based on, a trader should always consider the entire picture when entering a trade or planning a trading strategy." Bookmap's process opens the same way: "Start with the longest time frame in your chosen set".
How far apart should they sit?
Anywhere from two to sixteen times apart, going by the combinations above.
Litefinance states a rule for it: "The maximum timeframe should not exceed the previous one by more than five periods. If the H1 timeframe is the highest, then the next one after it may be a period not lower than M10."
Do that arithmetic before adopting it. An hour divided by five is twelve minutes, and the example printed beside the rule names ten, a step of six. The same publisher's long-term combination of daily, 4-hour and 1-hour puts the daily six steps above the 4-hour and the 4-hour four steps above the 1-hour, so the rule's own neighbours run at four and six rather than five.
Across all the combinations the steps spread much wider. The 30-minute down to the 15-minute is a step of two. The 4-hour down to the 15-minute is a step of sixteen. Litefinance's own glossary answer lands in the same place: "The ratio for multi time frame analysis isn't fixed; it varies based on individual strategy and market." Pick a spacing, write it down, and spend your attention on the rule instead.
Is there a best time frame for forex, gold or crypto?
No. The published answers attach a chart period to how long you hold, not to what you trade. Asked outright which time frame is best for forex, Litefinance answers in durations: "If a trader intends to trade intraday, it is best to choose H1 or M30. In turn, D1 is best suited for trading from a week to a month."
OANDA's version of the same point is that volatility and holding time drive the choice. So "best time frame for gold" is really asking how much gold moves relative to how long you hold it, and that is a question your own history can answer.
How do you enter with multiple time frames?
Most descriptions leave the trigger to you: the higher chart sets a bias, the lower chart is where you act. What counts as aligned is usually left undefined, and you have to pin that definition down before any test means anything.
Litefinance's three-timeframe method is the exception, because it is mechanical. It sets moving averages of 21, 13 and 8 across the three charts and states the trigger as "the same colors of the last candles on all three timeframes, as well as a trend reversal."
That is quoted because it is precise enough to test, not as a recommendation. Even it does not treat alignment on its own as a reason to act, pairing it with a reversal instead.
How do you test a combination on your own history?
You step one symbol through a replay with the higher chart read first, and you log the combination as a column so two of them can be compared afterwards.
Litefinance's advice at this point is to go quantitative and code it, that "traders should backtest quantified rules that combine higher and lower timeframe signals rather than reliance on discretionary decision-making". The version you can do by hand:
- Write the combination down first: which chart is the higher one, which is the entry chart, and what has to be true on the higher chart before you look at the lower one at all. If you cannot write that last part as a sentence, you do not have a rule yet.
- Pick one symbol and one stretch of history, and decide both before you see what happened in it.
- Read the higher chart and write your bias down before the entry chart is on screen.
- Step forward bar by bar on the entry chart and take every trade the rules give you, including the ones you dislike.
- Log each trade with the combination as one of its columns.
- Run the second combination over the same history, then compare the two logs rather than your memory of them.
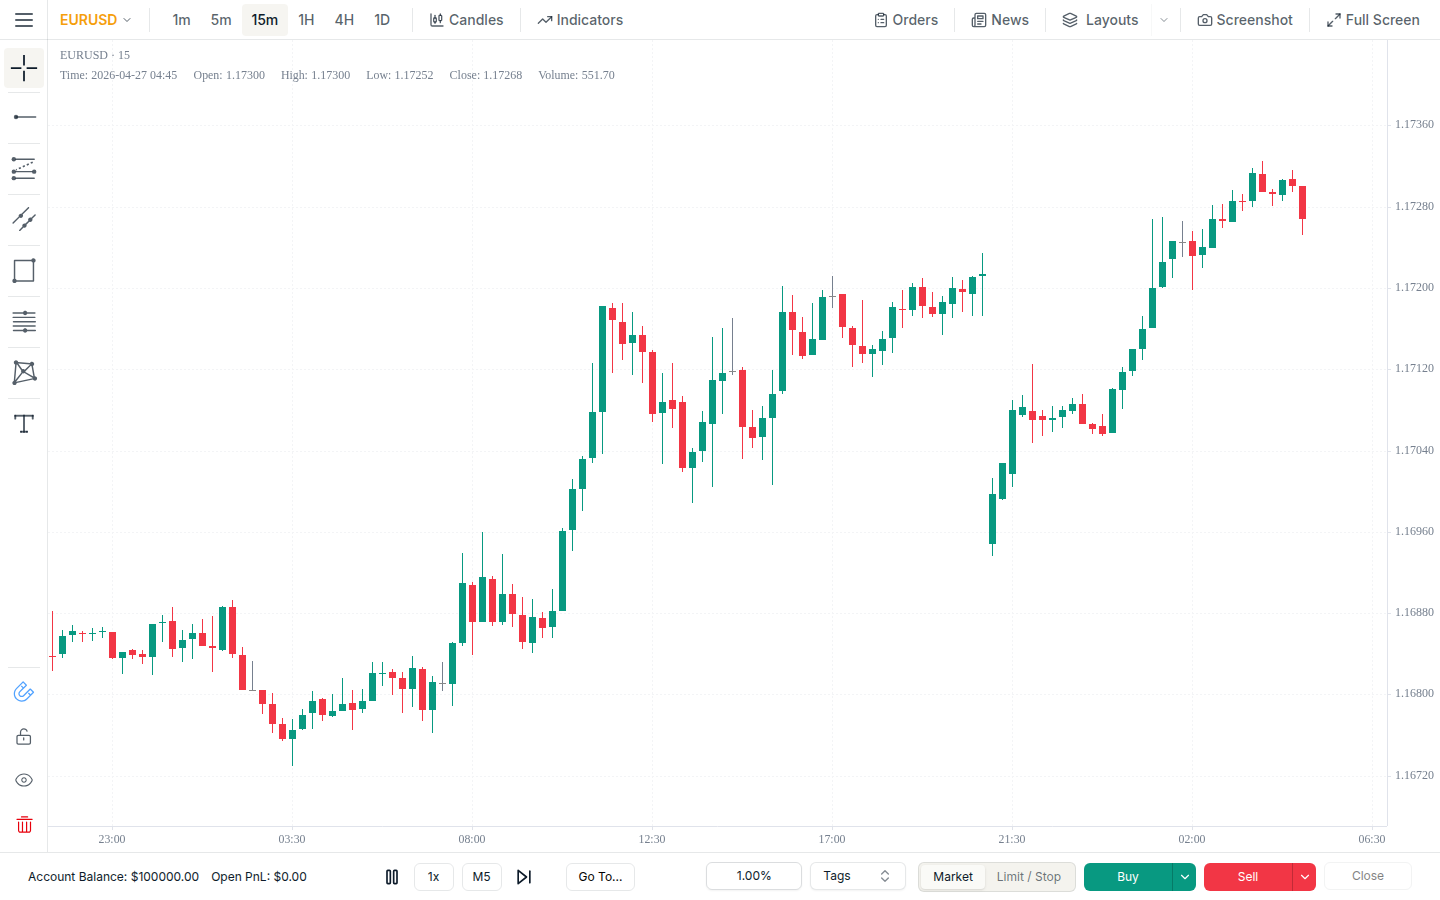
ChartLabs replays historical charts bar by bar, and changing timeframe mid-playback advances at the new one, so steps 3 and 4 work on a single chart whose period you change: read the higher period, switch down, keep stepping. Each symbol also reopens on the period you last used rather than resetting, which saves setting the pair up again every session. Our charts open as separate windows too, so a higher period can sit on a second monitor while you work on the entry chart.
The trap that makes every result flattering
You already know what happened next, and being careful about it does not remove it. Checking a higher-timeframe bias on history you have just stepped through produces a result that means nothing.
Two things reduce it. Write the higher-chart read down before the lower chart is on screen, so there is a record of what you thought rather than what you remember thinking. And when you compare two combinations, run the comparison on a stretch you have not stepped for either one, so neither gets the benefit of a second look.
What to record
The combination as its own column, written the same way every time, for example "4H / 15m". Without it a change of combination is invisible in the log and you end up comparing one mixture against another.
Then what the higher chart said at the moment you read it, the entry, stop, target, exit and result in R, and one more column: whether you would have taken the trade on the entry chart alone. It tells you whether the higher chart is earning its place.
In ChartLabs every trade saves a snapshot of the drawings, indicators and chart state you had at the moment of entry, so a trade you question later can be reviewed as you saw it. Trades carry tags and notes, analytics can be filtered by tag, and notes come through in the CSV export, which is enough to keep two combinations apart inside one strategy.
What goes wrong
Changing the combination before the log can say anything. Every change resets the sample, and a run of losses is exactly when changing feels most reasonable, which is what the 30-trade floor guards against.
Treating alignment as a reason to act. Every description here has the higher chart as context for a decision you still make on the lower one, and none of them makes aligned charts an entry by themselves.
Where to go next
Forex backtesting covers running a test on one market end to end, backtesting a trading strategy has the workflow, and backtesting across multiple monitors covers how the chart windows are arranged.
Two combinations over the same history, logged side by side, will settle this. ChartLabs replays historical charts bar by bar on forex, index, commodity and crypto symbols, with the chart period under your control. One plan, $20 a month or $200 a year, and the trial is 7 days with no credit card: start the free trial.
Related Topics
Related
Forex Backtesting: Test Your Strategy on Real Data
A practical guide to backtesting forex strategies: why session dynamics, spread variation, and pair-specific behavior change your results, what clean historical data actually means, and a five-step process for testing a strategy before you risk real capital.
Backtesting a Trading Strategy: A Beginner's Guide
What backtesting is, why it matters, and how to run one step by step: defining your rules, choosing clean historical data, stepping through the chart trade by trade, logging results, and reading the metrics that tell you whether your strategy has a real edge.
Backtesting Across Multiple Monitors: Charts, Drawings, and Shortcuts
How ChartLabs charts work across separate physical monitors, and the layouts, drawing tools, and keyboard shortcuts that go with them. Covers the five drawing shortcuts, the shared settings dialog, chart text notes, and what Esc, Delete, and End do.