Does Supply and Demand Trading Work? How to Find Out
Does supply and demand trading work? What a mechanical test of the published zone rules finds, why freshness stays unsettled, and how to test it.
Part of it can be tested and part of it cannot. The entry, stop and exit rules are specific enough to check against history. Where you draw the zone is a judgement, and no test settles a judgement.
We ran the testable part on two and a half years of hourly EUR/USD, and the result was inconclusive in a way worth knowing before you start. A mechanical reading of the published rules finds few zones, almost every one of them gets revisited many times over, and a repeated claim about them, that a zone is strongest on its first touch, came out in both directions depending on where we set the thresholds.
What is supply and demand trading?
A price action method that marks the ranges where price paused before a large move, then watches for a reaction when price comes back to them.
FTMO Academy puts it plainly: "Supply and demand trading is a price action-based trading strategy that is similar to horizontal support and resistance." The difference is what you draw. You mark an area rather than a line.
A demand zone is a consolidation that came before a large move up, and a supply zone is a consolidation that came before a large move down. FTMO Academy again: "The demand zones are found in consolidations before a large move up. The supply zones are found in consolidations before the large move down. The larger and more aggressive the move, the more significant Supply or Demand zone is."
Why price is supposed to react on the way back is an explanation rather than a measurement. FTMO Academy's version is that institutions "need enough liquidity in the order books not to get significant slippage", so they work inside consolidations, and "More often than not, they cannot execute all orders at once, so when prices drive away from the consolidation zone, they still have unfilled orders inside. That is why markets often react once zones are revisited."
FTMO Academy's page corrects a common mistake: the idea that a fast move happens "because there are more buyers than sellers". Their answer is that this "is not true since for every buyer there has to be a seller and vice versa."
How do you find a zone?
Three parts: the base, the departure, and the return.
TrendSpider describes the base as the pause before the move, marked by "Small candles", "Wicks indicating absorption" and "Low volatility". The departure decides whether it counts: a zone "becomes valid when the price leaves the base with" large candles and a break of structure.
The return is the part you would trade. FTMO Academy gives two ways in, a "set and forget approach when we put a limit order at the top of the demand zone or bottom of the supply zone", or waiting "for the initial reaction and enter with a market order". On the exit: "Our stop loss should always go to the other side of the zone, and we can target the next supply or demand zone or support and resistance area."
On what makes a zone worth anything, the two sources point at different things. Tradeciety points at the move that left the zone rather than at the zone itself, as a rule of thumb that "the stronger the breakout, the better the demand zone, and the more open interest will usually still exist", particularly when the consolidation was short. FTMO Academy points at the timeframe: "Zones on higher time frames will always carry more value than those on lower time frames."
Both of those are stated as preferences by the people who wrote them, and neither arrives with a count.
What we found when we tested the freshness rule
A fresh zone is one price has not come back to yet, and both sources that state the rule say freshness is what makes a zone work. Tradeciety tells you to make sure a zone is still fresh, which it defines as meaning that "after the initial creation of the zone, the price has not come back to it yet. Each time the price revisits a supply zone, more and more previously unfilled orders are filled and the level is weakened continuously." TrendSpider agrees in one line: "Old zones lose reliability: Fresh zones are stronger; tested zones weaken."
So we checked it. On 16,606 hourly EUR/USD bars from January 2024 to the end of August 2026, a demand zone is a base of three bars spanning no more than a set number of pips, followed by a close a set distance above the base within six bars. A touch is price re-entering the range. The measurement is whether price then passed through the bottom of the base within the next twelve bars, which is the zone failing to hold. No entry, no stop, no result: only whether the range survived.
| Base and departure | Zones found | Revisited | Median touches | First touch broke | Later touches broke |
|---|---|---|---|---|---|
| 10 pips, 20 pips | 48 | 46 | 19 | 80.4% | 75.5% |
| 10 pips, 30 pips | 18 | 18 | 17 | 66.7% | 73.7% |
| 15 pips, 30 pips | 79 | 78 | 15 | 57.7% | 66.2% |
Freshness barely exists as a state. 46 of the 48 zones were revisited on the first row, 18 of 18 on the second and 78 of 79 on the third, and the median zone was touched fifteen to nineteen times. A rule that says to trade only fresh zones is a rule that fires roughly once per zone and then never again, which is not how the setup is usually described.
Our comparison also does not settle the claim. On the first row the first touch broke more often than later ones, which is the opposite of what both sources predict. On the other two rows it broke less often, which agrees with them. The direction flips depending on where you put the thresholds, and the first-touch sample is never larger than 78 observations and is as small as 18. Numbers that small with a direction that flips do not support a conclusion in either direction.
Neither page that states the freshness rule shows a count, and a reasonable mechanical version of it on a liquid pair produces too few first touches to decide anything. Your own test will hit the same wall, so plan for a small sample from the start rather than discovering it at the end.
The same table shows the zone definition moving the answer too. Hold the base at 10 pips and widen the departure from 20 to 30 pips, and the first-touch break rate falls from 80.4% to 66.7%. Hold the departure at 30 pips and widen the base from 10 to 15, and it falls again, from 66.7% to 57.7%. Those rates rest on the same small samples, so read the spread as illustrative rather than measured. It is still reason enough to pin down what counts as a zone before you ask whether the method works.
Rules written so they can be tested
A rule you can check names the range, the trigger, the stop, the target and the exceptions.
- Zone definition. How many bars of consolidation, how wide the range may be, and on which timeframe.
- Departure filter. What counts as a large enough move away, defined so you get the same answer twice.
- Entry. A limit order at the zone edge, or a market order after a reaction you define. Those are two different rules with two different results, so test them separately.
- Stop and target. The far side of the zone, and the next zone or a fixed multiple. Pick one and hold it for the whole test.
- Exceptions. What you do when price cuts straight through, and what you do on a second touch.
Two cautions belong inside the rules rather than in your head. Tradeciety on the overshoot: "The price will often overshoot your support and resistance levels before turning in the anticipated direction." And TrendSpider on what zones are not: "Not effective in reaching markets: Price often cuts through zones without reaction." The table above puts a number on that second one, and it is a large number at every setting we tried.
What to record
Enough to rebuild the test from your notes: where the zone was, why it qualified, which touch this was, and what happened.
Per trade, record the date, the zone's top and bottom, the timeframe you drew it on, how the departure looked, which touch it was, your entry type, the stop, the target, the exit and the result. Per test, record the symbol, the date span, the zone definition and the costs you applied.
The touch count is the column people leave out, and without it the freshness rule is untestable.
Doing it in ChartLabs
You step historical charts forward bar by bar with the future hidden, draw your own zones, and place the orders the rule asks for. The order bar takes market, limit and stop orders with stop-loss, take-profit and a risk percentage, which matters here because the sources describe two ways in and testing both means placing both kinds of order.
A limit order that has not filled sits on its own Pending tab and draws faded on the chart until it does, so a resting order is easy to tell from a live one while you step forward:
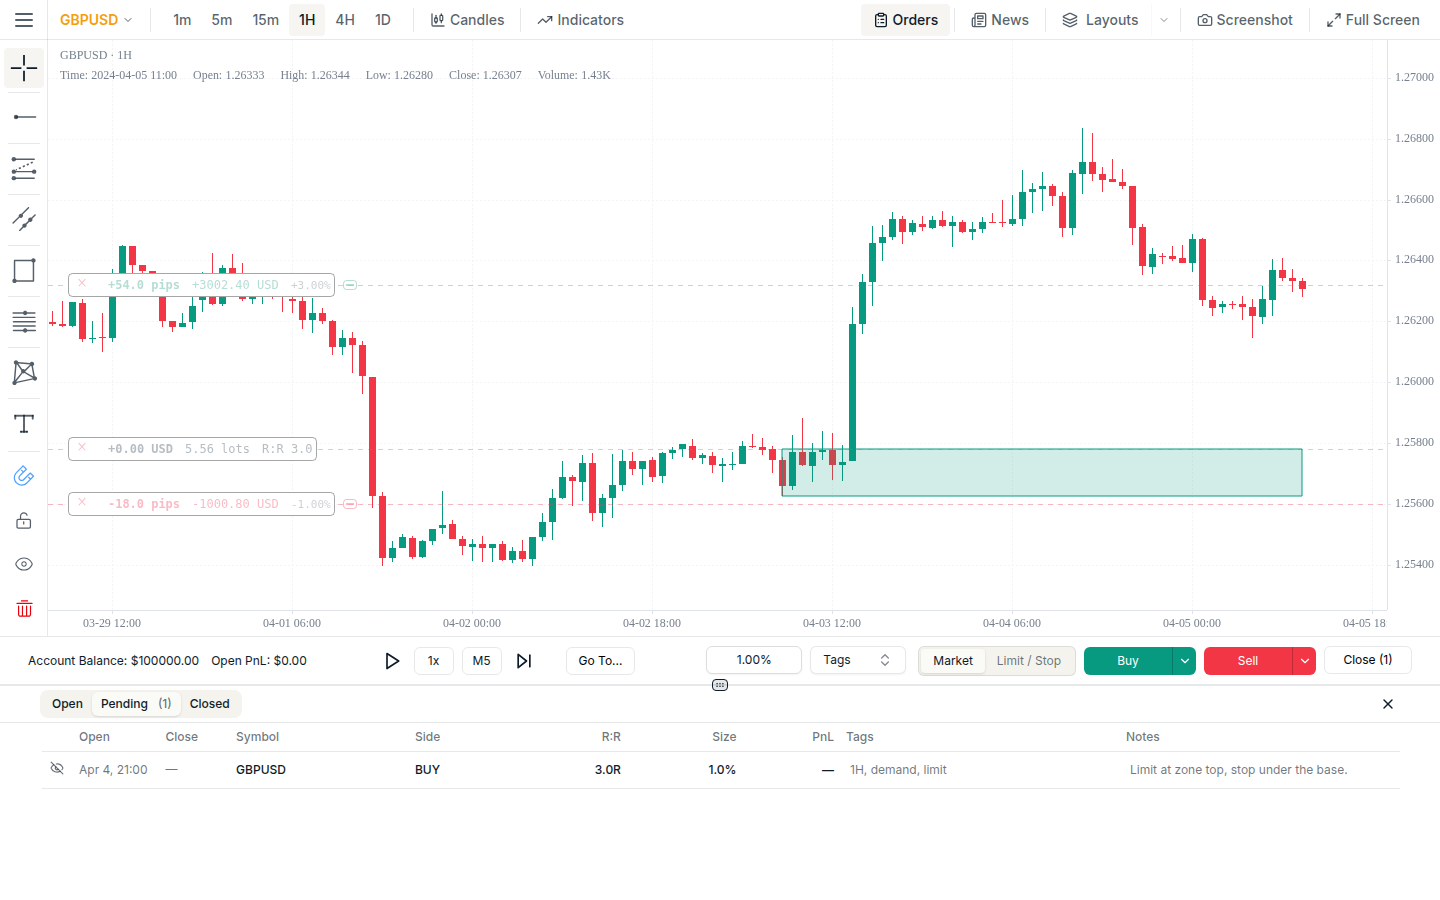
Every trade keeps a snapshot of your drawings and chart state at the moment of entry, so the zone you actually drew stays attached to the trade instead of being remembered later. Tag the trades by which touch they were and you can filter the analytics on it afterwards.
We do not find or mark zones for you. You draw them.
What goes wrong when people test this by hand
Three failures are specific to zones.
The base definition drifts. On Monday a two-bar pause counts, by Friday it needs four. Write it down before you start and you will at least know when you changed it.
The zone gets redrawn after the fact. Price came back, missed the range by a little, then ran. Widening the rectangle at that moment is an easy way to turn a losing test into a winning one, and it invalidates everything before it.
The touch count is wrong. Freshness only means something if you counted the earlier touches, and those are off the left edge of your screen. Scroll back before you call a zone fresh.
You will also meet this material in smart money or ICT vocabulary, which uses different names for some of the same structures. Different subject, not covered here.
Where to go next
Backtesting a Trading Strategy has the general workflow, and Forex Backtesting covers the data and session side.
One zone definition, one symbol, one year, and every touch recorded will tell you more about this method than a published rule will. ChartLabs is $20 a month or $200 a year, one plan with everything included, and the trial is 7 days with no credit card: start the free trial.
Related Topics
Related Guides
Backtesting a Trading Strategy: A Beginner's Guide
What backtesting is, why it matters, and how to run one step by step: defining your rules, choosing clean historical data, stepping through the chart trade by trade, logging results, and reading the metrics that tell you whether your strategy has a real edge.
Forex Backtesting: Test Your Strategy on Real Data
A practical guide to backtesting forex strategies: why session dynamics, spread variation, and pair-specific behavior change your results, what clean historical data actually means, and a five-step process for testing a strategy before you risk real capital.