Gold Backtesting: How to Test an XAUUSD Strategy
How to backtest a gold strategy on XAUUSD: which gold you are testing, how much history, what spread and commission do, and how to read the result.
To backtest a gold strategy you replay XAUUSD history bar by bar, take the trades your rules would have taken, and then read what the trades cost you as well as what they made. The parts that decide whether the result is worth anything are boring: which gold you tested, how much history you covered, and whether trading costs were applied at all.
There is no gold strategy below, and nothing here says when to buy gold.
How do you backtest a gold trading strategy?
Replay the chart forward one bar at a time and take each trade as the bar prints, without seeing what comes next.
In practice it runs like this:
- Write the rules down first, including the entry, the stop and the exit, so that nothing gets decided mid-test.
- Pick a date range you did not choose because you remember it. A period you remember is a period you already know the answer to.
- Replay bar by bar and place each trade with its stop and target, as you would live.
- Close the session and read the numbers, costs included.
- Do it again on a different period before you believe anything.
Step 2 is where most gold tests go wrong, because gold has had long stretches that behaved nothing like each other. A test that covers only one of them tells you about that stretch.
Which gold are you testing: spot XAUUSD, a CFD, or a futures contract?
They are different instruments and the answer changes your test. XAUUSD is gold quoted against the dollar as a spot price. A gold futures contract has an expiry, a delivery month and a roll, so a long-run futures chart is a series of contracts stitched together, and the stitch points are not prices anyone traded.
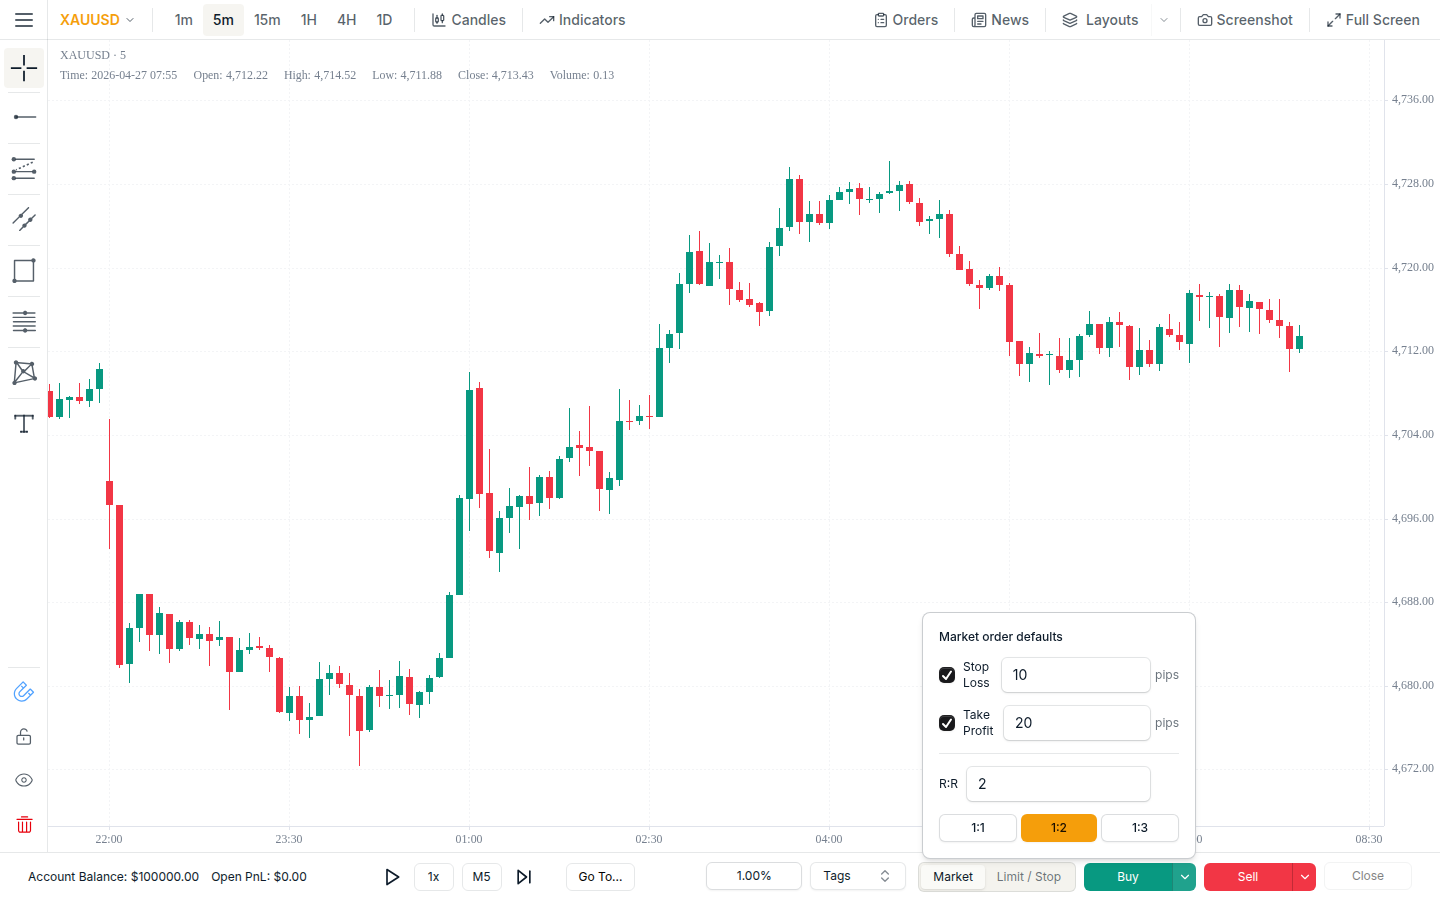
ChartLabs carries gold as the spot symbol XAUUSD, priced from Dukascopy's market data rather than from an exchange. There are no futures contracts on the platform at all, for gold or anything else. If your strategy is written for a futures contract with its own roll schedule and contract size, this is not the same instrument and you should know that before you read a result.
For most retail gold traders that is fine, because the account they trade is quoted in XAUUSD too. Test the thing you trade.
How much gold history do you need, and how far back can you go?
Gold history on ChartLabs starts in 2004, which is about 22 years. That is a fact about XAUUSD specifically: depth is per symbol, other instruments start later, and 2004 is not a figure you can extend to silver, platinum, copper or the energy symbols.
How much of it you need depends on what you are testing, and the answer is more than one kind of market:
- Gold spent years trending hard and years going nowhere. A strategy that needs a trend will look excellent in one and awful in the other.
- Test three or four separate periods rather than one long one. Separate periods give you separate answers you can compare, and one long run averages them into a number that hides both.
- Sessions matter more than calendar length for a day strategy. Fifty trades taken in the London hours of one quiet year is a thinner sample than it looks.
Depth only counts if you use it. Three months of 1-hour candles is a fast test, and it is not evidence about gold.
Which sessions matter for gold, and how do you test only those?
Gold trades nearly around the clock, so the session you trade is a choice you make rather than something the market imposes. A guide from the broker ACY Securities names "London AM, NY AM / PM sessions only" and "Only trade when volume enters". We are not going to tell you those hours are better, because we have not measured it.
You can test your own answer instead of taking theirs:
- Set your timezone once in preferences. Charts, trade times and every analytics breakdown then display in it, so a "9am" in your results is your 9am and not a server's.
- Pick the date range for the session, either by hand or by asking for random dates by length and period, so you are not always testing the months you remember.
- Then take trades only in the hours your rules allow, and let the record show whether you kept to them.
- Afterwards, read Timing Insights, which breaks your results down by the hour and the day you opened trades. If your London trades carry everything and your Asian-hours trades bleed, that shows up as two different columns rather than one blended average.
That last step turns somebody else's session claim into a number from your own rules.
What do spread and commission do to a gold backtest?
They turn a small edge into no edge. Gold's spread is wider than a major forex pair's and it widens further around news, so a strategy taking many small trades pays that gap far more often than a strategy holding for days.
A strategy averaging 8 points of profit per trade, paying 3 points of spread and slippage, keeps 5. Same trades, same entries, 37.5% less. Run the same test with costs switched off and it reports the 8.
ChartLabs applies commission and slippage per symbol, so P&L, balances and analytics reflect what trading actually costs. The Trading Costs card then reports Total Costs, Cost Drag and Avg Cost / Trade, which is where you find out whether your edge survives its own frequency. Set these before the test, not after: a backtest run with no costs and read as if it had them is how a gold result flatters itself.
Our article on backtesting accuracy goes further into the gap between a backtest and a live fill.
Can you backtest gold for free?
Yes, partly, and the limit is usually history rather than time. FX Replay's free Beginner tier is an example: its own pricing FAQ calls the plan "genuinely free", with "no credit card required, no trial period, and no automatic conversion to a paid plan". The tier caps the work instead. Their comparison table gives it two backtesting sessions, one indicator, a session spanning at most a month of chart history and one week of data retention.
On gold that cap is exactly the thing you came for. A month of XAUUSD covers one mood, and one mood is not a test.
ChartLabs is not free. There is a 7-day free trial with no credit card, then one plan at $20 a month or $200 a year with everything included. On gold that buys you history from 2004, 1-minute candles as the lowest timeframe, and costs applied per symbol.
If you are exploring whether you like manual backtesting at all, a free tier is a reasonable place to find out. If you are testing a gold strategy you intend to trade, depth is the whole point, and that is where free tiers stop.
How many gold trades before the result means anything?
Nobody has a threshold that holds up, and the number matters less than the spread of conditions those trades came from. 300 gold trades taken inside one trending year is a worse sample than 80 spread across a trend, a range and a news-heavy stretch.
Two things are more useful than a count:
- Run the test again on a separate period you have not looked at. If the second run does not resemble the first, the first was a description of that period.
- Use Monte Carlo Simulation. It does not reorder your own trades: it simulates fresh sequences from your strategy's own statistics. In the app's words, "Each simulated trade risks 1% of the account and wins, loses or breaks even as often as your strategy did. A loss costs the 1%, a breakeven costs nothing, and a win pays your average win divided by your average loss." Run it and you see how widely results spread out when the same win rate and payout arrive in a different order.
Neither of those tells you your sample is big enough. They tell you how much of your result you should trust.
What do you do with the results?
Read the costs and the drawdown before the profit, then go back to the individual trades. Totals tell you whether something happened; the trades tell you what.
Two cards carry most of the gold-specific answer. Trading Costs reports Total Costs, Cost Drag and Avg Cost / Trade, which is where a high-frequency gold strategy either survives its own spread or does not. Timing Insights breaks the results down by open hour and open day, which is where the session question gets settled. Max Drawdown is the third number to read before the profit, because a return without the risk taken to reach it is not a result.
Every trade captures a snapshot of your drawings, indicators and chart state at the moment of entry, so you can reopen a trade and see exactly what you saw when you took it. Write a note on why you took it, and tag it: the Orders panel shows up to five tags per trade, and you can filter the analytics by tag. If your gold breakout entries hold up and your reversal entries do not, tags are how you find that out instead of guessing.
On sizing, gold guides commonly suggest a fixed fraction of the account per trade, and the ACY Securities guide names 0.5% to 1% of fixed risk per trade. Whatever fraction you use, the chart order bar has a risk percentage control that sizes the position from your stop distance, so the size follows the stop rather than a round lot number. If you are aiming at a prop firm rule set, our prop firm guide covers how sizing alone changes which rules you stay inside.
Where gold sits beside the rest
The method here is the same one in our forex backtesting guide; what changes for gold is the cost per trade, the session question and the fact that the history goes back to 2004. Data is sourced from Dukascopy, tick-level where it is available, cleaned to remove anomalies, and converted to 1-minute candles as the lowest timeframe. If you have never run a backtest at all, start with the beginner's guide and come back here.
Where to start
Pick a gold strategy you already trade, take 30 trades on a period you do not remember, and look at Cost Drag before you look at the profit.
Start the free trial: 7 days, full access, no credit card. After that it is $20 a month or $200 a year.