What Is the Risk-Reward Ratio? Formula and Example
What is the risk-reward ratio: the formula, a worked example, the break-even win rate that goes with each ratio, and where it shows up in a backtest.
The risk-reward ratio compares what you stand to lose on a trade against what you stand to gain. Risk 2 points to make 6 and the ratio is 1:3, meaning one unit of risk for three units of reward.
IG defines it as "a way of assessing the expected return on a trade per unit of risk". TechTarget adds the notation: "The risk-reward ratio is typically expressed as a figure for the assessed risk separated by a colon from the figure for the prospective reward."
A ratio on its own tells you nothing about whether a strategy makes money. It only means something next to the win rate it is paired with.
What is the risk-reward ratio formula?
Two distances, measured in price, then divided.
- Risk distance = entry price minus stop price, for a long trade.
- Reward distance = target price minus entry price.
- The ratio = 1 : (reward distance divided by risk distance).
Risk goes first, which is the more common convention and the one IG and TechTarget both use. Measure in price distance rather than in money, because then the ratio stays the same whatever size you trade.
The notation trap
You will see the same trade written both ways round, and it is a common source of confusion in the term. TechTarget states it directly: "It's important to note that some traders use the ratio in reverse -- that is, depicting a reward-risk ratio. It similarly calculates the potential reward, or net profit, against the potential risk, or the amount that could be lost. This is presented as a mirror image of the risk-reward ratio: A reward-risk ratio of 3:1 indicates a $3 potential reward for every $1 risked."
So 1:3 and 3:1 can describe the identical trade, depending on which figure the writer put first. When you read a ratio anywhere, including in your own notes from last month, check which way round it was written.
A decimal turns up as well. IG gives their example as "So, if you risk $100 and expect to make $300, your R/R ratio will be 1:3, or 0.33." Their rule for reading the decimal: "the general rule is a risk-to-reward ratio of over 1.0 means the possible risk is greater than the possible reward, and anything below 1.0 means the possible profits are greater than the potential risk."
Those two notations give the same trade three names. Risked $100 to make $300 is 1:3, or 3:1 reversed, or 0.33 as a decimal.
A worked example
Round numbers, as an illustration only, not a result to expect.
Say an instrument trades at 100. You buy, put the stop at 98 and the target at 106.
- Risk distance: 100 minus 98, which is 2.
- Reward distance: 106 minus 100, which is 6.
- Ratio: 6 divided by 2 is 3, so the ratio is 1:3.
Move the stop to 97 and nothing else changes: risk 3, reward 6, ratio 1:2. Move the target to 103 instead: risk 2, reward 3, ratio 1:1.5. The ratio is a property of where you put the two lines, which is why it is knowable before the trade rather than after.
What is a good risk-reward ratio?
No number is good in isolation. A ratio only becomes meaningful once you put a win rate next to it.
The received answer is worth knowing, because you will meet it often. TechTarget: "While the acceptable ratio can vary, trade advisers and other professionals often recommend a ratio between 1:2 and 1:3 to determine a worthy investment." For Traders, a prop firm, declines to give a universal figure. Under their heading "What is a good risk to reward ratio in trading?" they write: "There's no universal best risk reward ratio in trading".
Apply the arithmetic to your own measured win rate and the reason becomes obvious. A 1:5 strategy that wins a tenth of the time loses money. A 1:1 strategy that wins six times in ten makes it. The ratio alone cannot tell those two apart.
What win rate do you need to break even at a given ratio?
One divided by one plus the reward multiple. At 1:2, that is 1 divided by 3, so a third of your trades have to win for you to finish level.
Worked through for the common ratios:
| Ratio | Reward per 1 risked | Break-even win rate |
|---|---|---|
| 1:1 | 1 | 50% |
| 1:1.5 | 1.5 | 40% |
| 1:2 | 2 | 33.3% |
| 1:3 | 3 | 25% |
| 1:5 | 5 | 16.7% |
Every figure in that column is a floor. Hitting it exactly means finishing where you started, before costs, and costs are not optional.
For Traders make the same point under their own break-even table: "Spread, commission, and slippage don't show up in the theoretical formula, but they show up in your equity curve." They also put a size on the gap, expecting the real-world break-even win rate to sit 1 to 3 percentage points above the textbook figure. That is their estimate on their page, not a number we have measured, and the direction is the part to keep: the real floor is above the one in the table, never below it.
One claim about ratios runs into this. TechTarget writes: "A favorable risk-reward ratio can lead to profitability even if the win rate is low. For example, if a trader has a risk-reward ratio of 1:3, they can still be profitable by winning only 1 out of 4 trades, provided their average profit per trade exceeds their average loss."
Count one win in four at 1:3. The win returns 3 units of risk. The three losses cost 1 unit each, so 3 units. Three minus three is zero. One in four at 1:3 is the break-even line itself, which is what the table says too, and a strategy sitting exactly on it makes nothing before costs and loses after them. The qualifier at the end of their sentence is doing all the work: it takes more than one win in four at 1:3, not exactly one.
Should the risk-reward ratio be high or low?
Neither answer holds on its own. A larger reward multiple buys you room to be wrong more often, and it usually costs you something to get, because a target further away is hit less often.
That trade-off is the reason the two numbers have to move together. If you widen the target and your win rate falls faster than the break-even line drops, you are worse off with the prettier ratio. The only way to know which happened is to measure your own trades at both settings.
Why is my realised ratio worse than the one I planned?
Because the planned ratio is what you set when you placed the trade, and the realised one is what the trade actually returned.
Three things move it, and all three are ordinary. You closed part of the position early, so some of it never reached the target. You trailed the stop and got taken out closer to entry. Or the exit filled a little worse than the level you drew, which is slippage, and it comes out of the reward side while leaving the risk side alone.
None of that is a mistake in itself. It does mean the number worth judging your strategy by is the realised one, measured over many trades, while the planned one is a rule for choosing trades.
Where does the risk-reward ratio show up in a backtest?
Twice: once when you place each trade, and once as a statistic across all of them.
In ChartLabs the planned side is set where the order is placed. The order bar handles market, limit and stop orders with stop-loss, take-profit and risk/reward built in, so the ratio is visible at the moment you commit to the trade rather than worked out afterwards.
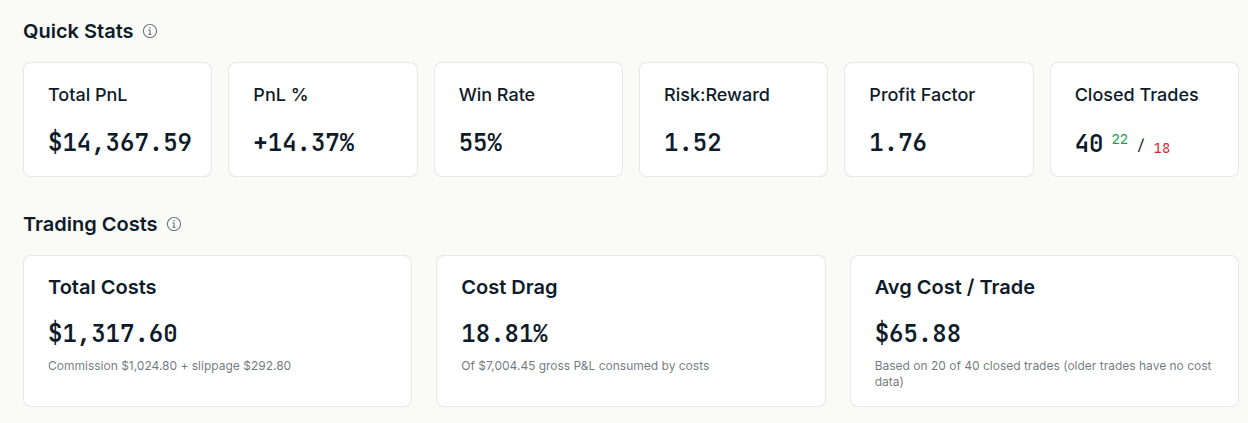
The measured side sits in Quick Stats, where Risk:Reward and Win Rate are shown side by side with Total PnL, PnL %, Profit Factor and Closed Trades. Those first two are the pair the arithmetic above needs: either one alone tells you very little, and together they tell you whether a ratio is actually paying for itself on your own trades. The Risk Management block adds Profit Lock Rate, Average Initial Risk and Breakeven Rate, which is where stop discipline becomes visible.
Costs get their own place too, in Trading Costs: Total Costs, Cost Drag and Avg Cost / Trade. That matters because the break-even table ignores costs and your account does not.
We do not compute a break-even win rate or an expectancy figure for you. The two numbers are on screen and the comparison is yours to make.
Risk-reward ratio and R multiple: what is the difference?
The risk-reward ratio is planned, set from your stop and target before you enter. An R multiple is realised: what a closed trade returned in units of the risk you originally took, so a trade that made twice its risk was a 2R trade.
One is a rule for taking trades, the other is a way of scoring the ones you took. Over a few hundred trades the gap between your average planned ratio and your average R multiple is itself worth reading, because that is the cost of how you manage positions.
Where to go next
Backtesting a Trading Strategy covers running a test properly, which is how you get a win rate worth putting next to your ratio. Backtesting Accuracy covers what slippage and spread do to the reward side.
Next step
Set the ratio when you place the trade, then read it next to your win rate over a few hundred of them. ChartLabs is $20 a month or $200 a year, one plan with everything included, and the trial is 7 days with no credit card: start the free trial.
Tags
Related
Backtesting a Trading Strategy: A Beginner's Guide
What backtesting is, why it matters, and how to run one step by step: defining your rules, choosing clean historical data, stepping through the chart trade by trade, logging results, and reading the metrics that tell you whether your strategy has a real edge.
Backtesting Accuracy: How Slippage and Data Quality Matter
Why backtest results and live results drift apart, and what actually closes the gap: clean tick data, honest spread assumptions, and commission and slippage modelled directly on every trade you log.