What Are Range Bars? The Rule, With an Example
What range bars are: a bar closes after price covers a set distance, not after a set time. The rule, a worked example, range bars vs tick bars and Renko.
A range bar is a bar that closes once price has covered a set distance, instead of after a set amount of time. A 10-point range bar ends when the move from that bar's own high to its own low reaches 10 points, whether that takes four seconds or four hours.
Chart types differ in what ends the bar. Time ends a 5-minute candle. A count of trades ends a tick bar. A distance of price ends a range bar.
How is a range bar built?
One rule: accumulate price movement until it reaches the size you set, then close the bar and start the next one where the last one ended.
thinkorswim's documentation states the mechanism precisely. On range charts generally: "Range charts represent price action in terms of price accumulation. Two modes of range aggregation are available in Charts: Range Bars and Renko Bars." On the bars themselves: "In the Range Bars mode, a new bar (or candlestick, line section, etc.) is plotted after a specified price range has been accumulated. Each new bar opens at the previous bar's close price, which coincides with either high or low of that same bar, depending on its direction."
A range bar has no gap between it and the next one. The close of one bar is the open of the next, and that close sits at either the high or the low of the bar it ended, depending on which way price was going.
A worked example
Round numbers, for illustration only, not real data from any symbol.
Take a 10-point range bar on an index. The bar opens at 20,000.
- Price runs straight up to 20,010. That is 10 points from the bar's low to its high, so the bar closes there.
- Or price falls straight to 19,990. Also 10 points of range, so the bar closes there too.
- Or price wanders up to 20,004 and then down to 19,994. Still 10 points from high to low, and the bar closes on that.
In all three cases the next bar opens at the close of the one before, which is that bar's high or its low depending on direction.
The same bar size covers three very different amounts of elapsed time.
Range bars vs tick bars
A tick bar closes after a count of trades. A range bar closes after a distance of price.
thinkorswim's tick chart documentation: "Tick charts plot price based on the number of trades (ticks). A new bar (or candlestick, line section, etc.) is formed each time a specified number of trades is completed."
So a 10-trade tick bar closes after ten trades whether price moved a point or a hundred, and a 10-point range bar closes after ten points whether that took ten trades or ten thousand. The two can disagree sharply in thin conditions, where a handful of trades move price a long way. Their documentation also notes a practical limit on their own platform: "Tick aggregation can be used on intraday charts with a maximum time interval of five days."
Range bars vs Renko
A Renko brick needs the move to carry a full brick away from the last brick. A range bar counts the span of its own high to its own low, whichever directions that span was made up of.
TradingView's Renko documentation puts the core of it in one line: "Renko charts measure only price movement." On how a brick forms: "With Renkos, brick size is predetermined by the user. Once the price moves more than the user-defined brick size, either above or below the most recent brick, a new brick is added to the chart." Renko also carries placement rules that range bars do not: "Bricks always have their corners touching." And: "There can never be more than one brick in any vertical column."
Their worked example: with a two-point brick size and the last brick spanning $52 to $54, a new brick needs price to close at or above $56, or at or below $50.
thinkorswim states the contrast from the other side, on their own range chart page: "The difference between the Renko Bars and the Range Bars is in the Renko Bars a new brick does not appear until a specified range is accumulated. For example, on a five-point chart, the price rising from 95 to 102 produces a hollow brick from 95 to 100, however, a hollow brick ranging from 100 to 105 is not drawn."
Take the third case from the example above, the swing up to 20,004 and back down to 19,994. It closes a 10-point range bar, because the bar's high to its low is 10 points. It would not complete a 10-point Renko brick, because price never got 10 points away from the previous brick's edge at 20,000: four points above it at most, and six points below. The range bar measures a span, the brick measures a distance travelled from a fixed level, and the same wobble satisfies one and not the other.
Range bars vs candlesticks
These two words answer different questions. A candlestick is how a bar is drawn. A range is what closes it.
You can draw range bars as candlesticks, as bars, or as a line, and thinkorswim's own wording allows for that: a new bar "(or candlestick, line section, etc.)" is plotted. So a chart is described by two separate choices, the shape and the trigger, and the trigger changes your results.
| Bar type | What closes the bar | What you set |
|---|---|---|
| Time bar (the usual candle) | The clock | The interval, for example 5 minutes |
| Tick bar | A count of completed trades | The number of trades |
| Range bar | The distance from the bar's high to its low | The range size |
| Renko brick | A move of the brick size away from the last brick | The brick size |
What do range bars change in a backtest?
They change how many bars a quiet period produces, and therefore how many decisions you make. Time bars give you a bar every interval whether anything happened or not. Range bars give you none until price moves, and a run of them when it does.
Your bar count stops being a proxy for elapsed time. Fifty range bars might be one busy hour or two slow days, so a date range no longer tells you how much chart you are about to step through.
Your trade count can go up. Setups that need a bar to close arrive faster in fast conditions. That is where costs start to matter: commission and slippage are applied per symbol in ChartLabs and flow into every trade's P&L, balances and analytics, so the Trading Costs card and the closed trade count in Quick Stats are the numbers to watch when a bar type changes how often you trade. A higher trade count at the same average result is a worse result after costs.
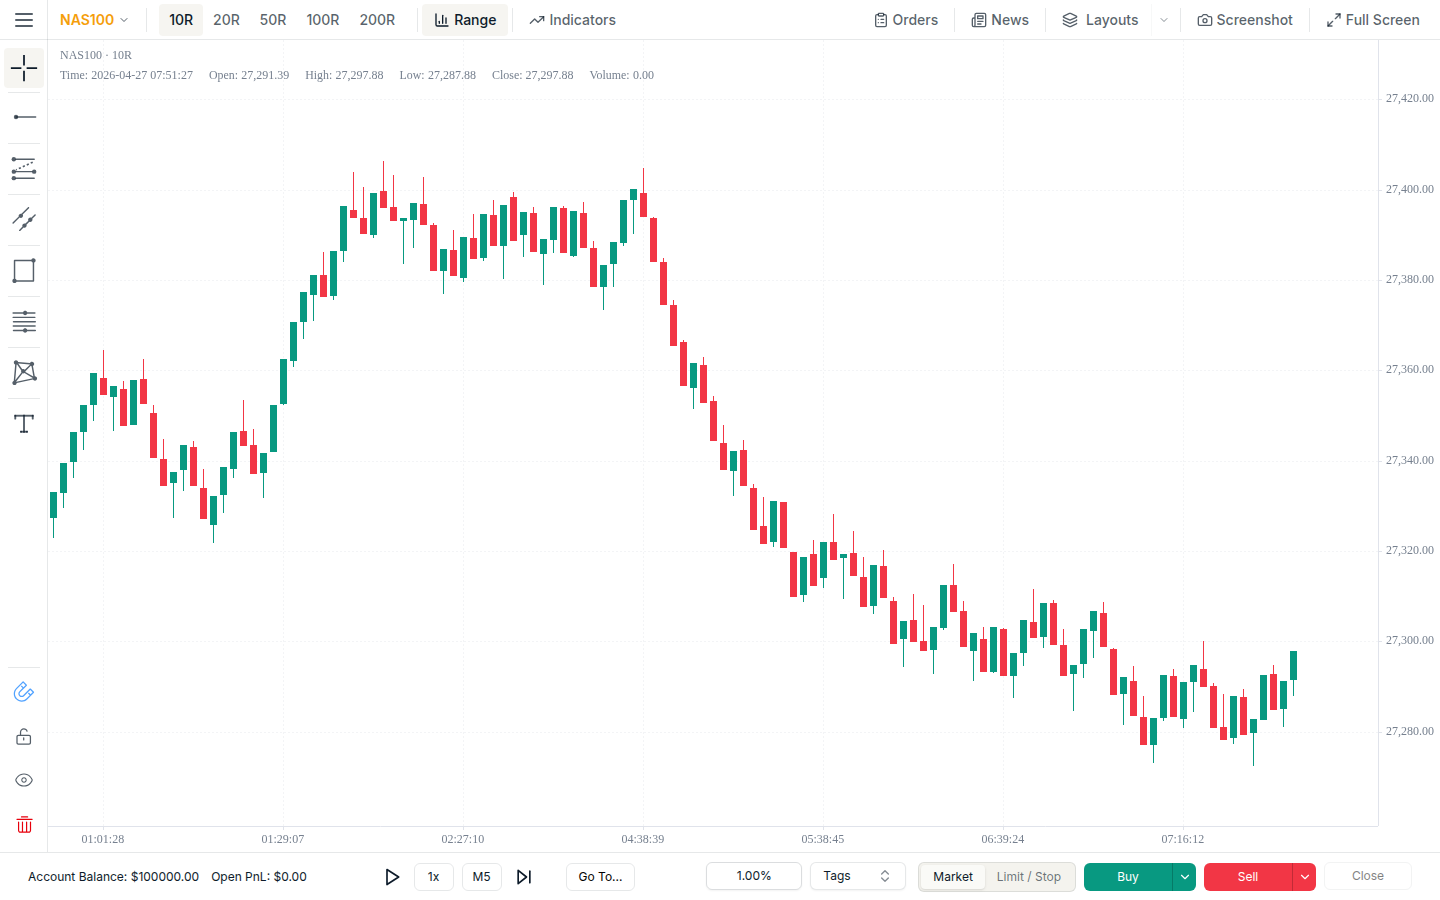
Your fills have to be resolved on something finer than the bar. A bar that closes on price movement is only as trustworthy as the prices it was built from. In ChartLabs, range bars replay trades on price movement instead of clock time, with entries and exits filled at the exact tick that crossed your level, and the earlier of your stop and target wins.
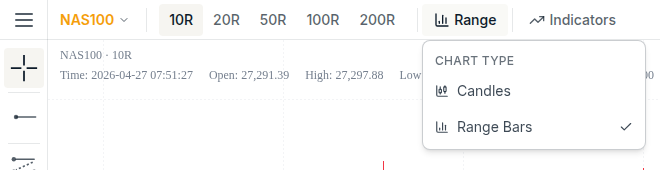
Two limits on ours. NAS100 is currently the only symbol with range bars, with more than 13 years of history behind them. The sizes on offer come from a per-symbol list on the server rather than a fixed menu, and the unit follows the asset class: pips for forex, points for indices, dollars for metals, energy and crypto. Index range bars roll on each instrument's real trading day and follow daylight saving rather than drifting an hour twice a year.
What has to be true of the data underneath?
A range bar is only as precise as the prices it was assembled from, and the answer differs by platform, so it is worth asking of whichever one you use.
For ChartLabs the answer is that range-bar fills resolve on real ticks. An entry or exit is filled at the tick that crossed your level, and when a stop and a target both sit inside the same bar, the earlier of the two wins rather than whichever the bar's shape happens to favour. The underlying history comes from Dukascopy, tick-level where it is available, cleaned to remove anomalies, and built into 1-minute candles as the lowest chart timeframe.
thinkorswim documents something different for their own charts. They warn that "For longer chart time intervals, the older the data is, the less precise the visualization could be", then set out four tiers by the age of the bar: the last seven astronomical days including the current day come from tick-level data, bars 7 to 14 days old from 1-minute aggregates, bars 14 to 194 days old from 1-hour aggregates, and anything older than 194 days from daily aggregates. The same page notes that "You can view up to 40,000 bars on a single chart."
Where a bar comes from an aggregate rather than from ticks, thinkorswim builds it in a fixed order: "open price", then "high or low price (whichever is closer to open)", then "high or low price (whichever is farther from open)", then "close price". The shape is reconstructed from a rule rather than from the order price actually moved in, so two days that traded very differently inside the same daily bar come out as the same sequence.
That is a design choice rather than a defect, and it only bites at the dates where it applies. A bar whose whole purpose is to close on a price move becomes a different object when its source is a daily aggregate, and a stop-and-target test run on bars like those is testing the reconstruction as much as the strategy.
For the general version of this problem, Backtesting Accuracy covers what data quality and slippage do to a result, and Backtesting a Trading Strategy has the workflow for running the test itself.
Next step
Step through the same setup in time bars and in range bars and see which one shows you the move. ChartLabs is $20 a month or $200 a year, one plan with everything included, and the trial is 7 days with no credit card: start the free trial.
Tags
Related
Backtesting Accuracy: How Slippage and Data Quality Matter
Why backtest results and live results drift apart, and what actually closes the gap: clean tick data, honest spread assumptions, and commission and slippage modelled directly on every trade you log.
Backtesting a Trading Strategy: A Beginner's Guide
What backtesting is, why it matters, and how to run one step by step: defining your rules, choosing clean historical data, stepping through the chart trade by trade, logging results, and reading the metrics that tell you whether your strategy has a real edge.