Manual Backtesting Builds Better Traders
Stepping through historical charts by hand teaches what an automated backtest report cannot: pattern recognition, what a normal drawdown feels like, and the discipline to follow your own rules when it is uncomfortable.
There are two ways to backtest a trading strategy.
The first is automated. You write some rules, press a button, and the software runs through historical data in seconds. You get a report: win rate, profit factor, max drawdown. Numbers on a screen.
The second is manual. You step through historical data yourself, candle by candle. You see the market unfold. You make decisions in real time, just like you would with real money at risk. You feel the uncertainty of a setup forming. You feel the tension of holding through a pullback. You feel the temptation to exit too early.
Both approaches give you data about whether a strategy works. But only one of them teaches you what it feels like to trade that strategy.
That difference matters more than most traders realize. When we set out to build ChartLabs, the easier path would have been to build another automated tool. The market is full of them. We went the other way on purpose.
The Confidence Problem
Most traders who fail don't fail because their strategy is bad. They fail because they don't trust it enough to stick with it when things get uncomfortable.
They hit three losing trades in a row and abandon ship. They see a drawdown that's completely normal for their strategy, but it doesn't feel normal because they've never experienced it before. They make emotional decisions because they haven't built the muscle memory to execute their plan under pressure.
Automated backtesting can't fix this. A report that says "max drawdown: 8%" doesn't prepare you for what an 8% drawdown feels like in real time. The number is abstract until you've lived through it.
Manual backtesting forces you to live through it, hundreds of times, across years of data, before a single dollar is at risk.
What Practice Actually Does
Think about any skill-based discipline. Athletes don't read about competition. They train. Musicians don't study theory alone. They practice. Pilots don't just read the manual. They spend hours in a simulator.
Trading is a skill. Like any skill, reading about it isn't enough. You need repetitions.
Manual backtesting is practice. Each trade you step through builds pattern recognition. Each losing streak you endure builds emotional resilience. Each session where you stick to your rules builds discipline.
After a few hundred trades on historical data, something shifts. The strategy stops being an idea and starts being something you've done. You know its rhythms. You know what a normal losing streak looks like. You know when a setup is textbook and when it's marginal.
That knowledge doesn't come from a backtest report. It comes from experience.
The Discipline Nobody Can Automate
Automated backtesting removes you from the equation. That's its selling point, and its biggest limitation.
In live trading, you are the variable. Your emotions, your hesitation, your overconfidence: these are the things that separate profitable traders from everyone else.
Manual backtesting puts you back in the equation. It exposes your weaknesses before real money does. Do you chase trades? You'll notice it in backtesting. Do you move your stop loss? You'll catch it. Do you skip setups because they "don't feel right"? You'll see the pattern.
You can't automate your way out of a discipline problem. You have to practice your way through it.
Why Not Both?
That's a fair question. Many traders use automated backtesting to validate an edge, then manual backtesting to practice executing it. The two approaches complement each other.
We focus on the manual side because it's the underserved half. There are plenty of automated backtesting tools. There are very few that make manual backtesting simple and reliable enough that traders actually do it.
That's the gap we're filling.
How ChartLabs Approaches This
We built ChartLabs specifically for manual backtesting because we believe it's the most effective way to prepare for live trading.
The platform gives you clean historical data, with depth that varies by symbol: the oldest forex pairs reach back around 22 years, and other markets start later. You step through candle by candle, place market, limit, or stop orders, set your stop loss and target, and the platform tracks everything automatically.
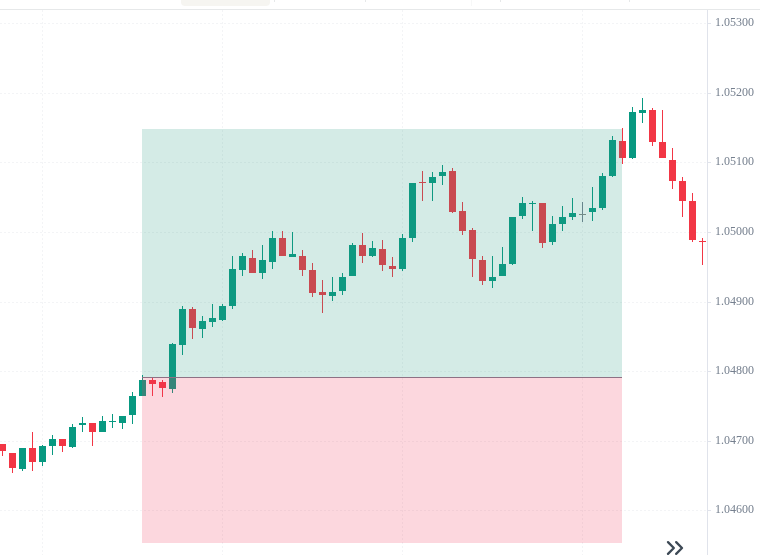
Every trade gets logged with full analytics: equity curve, risk-adjusted returns, Monte Carlo simulation, timing insights. Tag your trades to filter and refine your strategy later. And if you had drawings on the chart when you placed a trade, they are saved with it: reopen that trade from the Closed tab and the chart returns to the moment you took it, with your own markup back on screen.
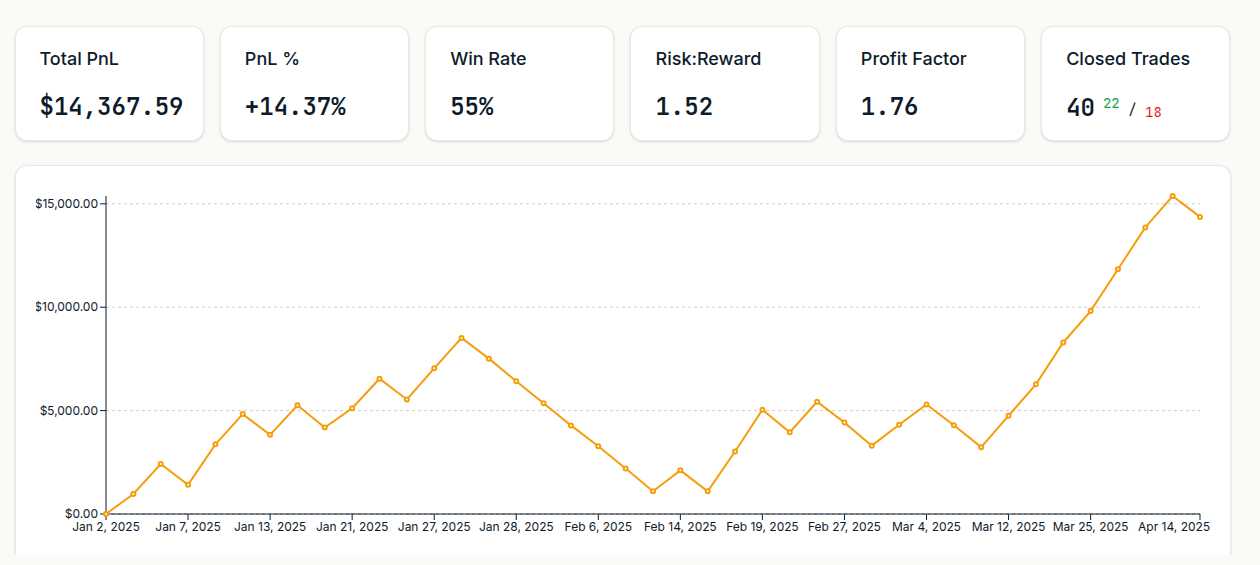
Every choice in the platform follows from the same idea. The charting interface stays clean, because feature bloat gets between you and the work. The data is cleaned before it reaches you, because unreliable data undermines the whole exercise. The analytics are thorough, because once you have done the work you deserve a complete picture of how your strategy performed. And there is no gamification, because practice should feel like practice rather than a mobile game.
It's not complicated. It's not gamified. It's just practice that counts.
The Bottom Line
Automated backtesting tells you if a strategy has an edge. Manual backtesting teaches you how to trade that edge.
Both have their place. But if you want to build the confidence, discipline, and pattern recognition to actually succeed in live markets, there's no substitute for doing the work yourself.
That's what we built ChartLabs for.